. 2002 Jun;109(11):1453-62.
doi: 10.1172/JCI15078.

CD19-dependent B lymphocyte signaling thresholds influence skin fibrosis and autoimmunity in the tight-skin mouse

Affiliations

CD19-dependent B lymphocyte signaling thresholds influence skin fibrosis and autoimmunity in the tight-skin mouse

Eriko Saito et al. J Clin Invest. 2002 Jun.

Abstract

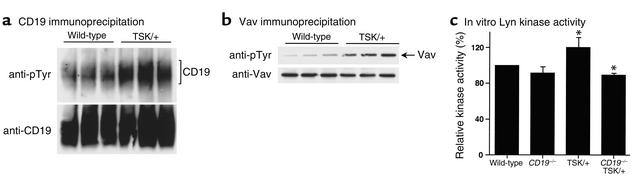
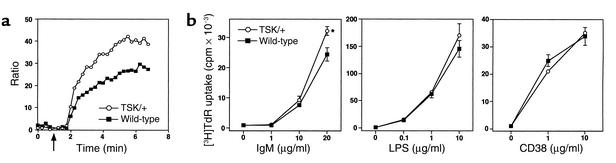
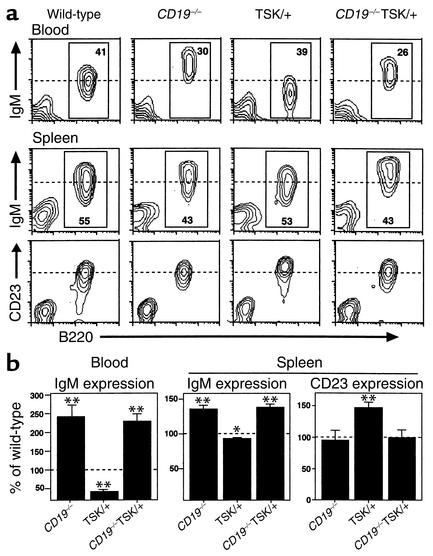
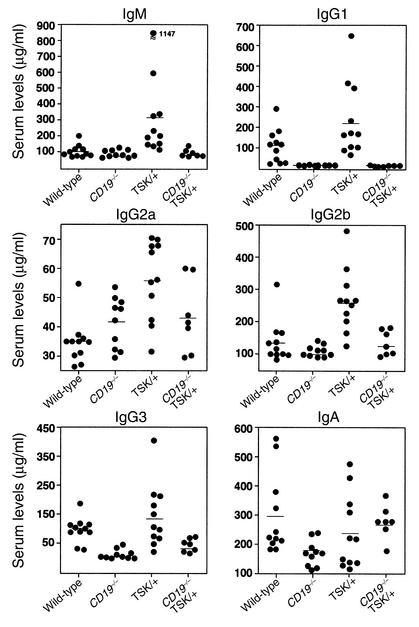
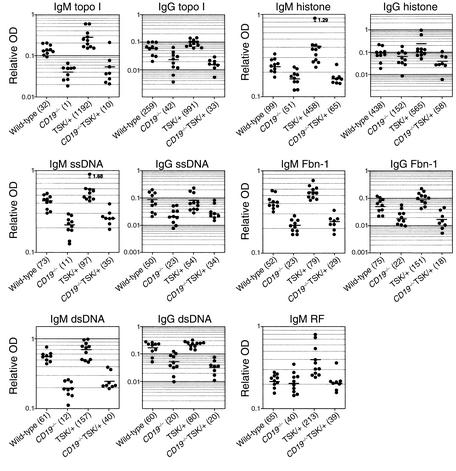
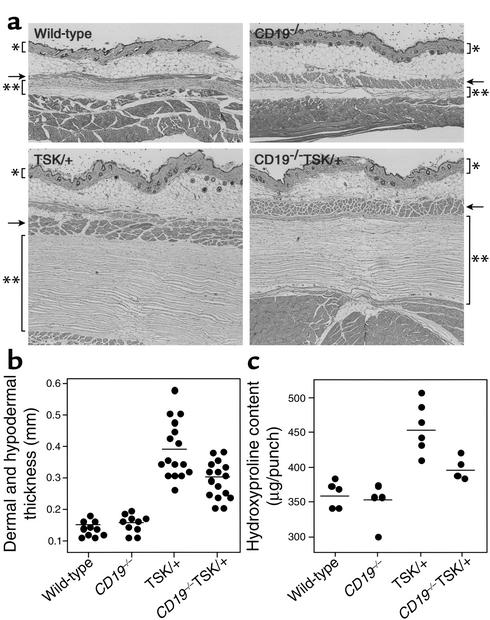
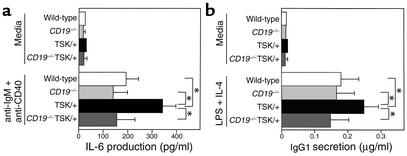
The tight-skin (TSK/+) mouse, a genetic model for human systemic sclerosis (SSc), develops cutaneous fibrosis and autoantibodies against SSc-specific target autoantigens. Although molecular mechanisms explaining the development of fibrosis and autoimmunity in SSc patients or TSK/+ mice remain unknown, we recently demonstrated that SSc patients overexpress CD19, an important regulatory molecule expressed by B lymphocytes. B cells from CD19-deficient mice are hyporesponsive to transmembrane signals, while B cells overexpressing CD19 are hyperresponsive and generate autoantibodies. In this study, TSK/+ B cells also exhibited a hyperresponsive phenotype with decreased surface IgM expression, enhanced serum Ig production, and spontaneous autoantibody production. Moreover, CD19 tyrosine phosphorylation was constitutively augmented in TSK/+ B cells. CD19-mediated [Ca(2+)](i) responses, Vav phosphorylation, and Lyn kinase activity were similarly enhanced. Studies of TSK/+ mice deficient in CD19 expression demonstrated that CD19 deficiency significantly decreased skin fibrosis in TSK/+ mice. Additionally, CD19 loss in TSK/+ mice upregulated surface IgM expression and completely abrogated hyper-gamma-globulinemia and autoantibody production. CD19 deficiency also inhibited IL-6 production by TSK/+ B cells. Thus, chronic B cell activation resulting from augmented CD19 signaling in TSK/+ mice leads to skin sclerosis possibly through IL-6 overproduction as well as autoimmunity.


Figures

Figure 1
Figure 1
CD19 signal transduction in B cells from TSK/+ and wild-type littermates. (a and b) Constitutive tyrosine phosphorylation of CD19 (a) and Vav (b) in B cells. Splenic B cells were obtained from three mice of each group. Proteins were immunoprecipitated from lysates of unstimulated B cells with either anti-CD19 or anti-Vav Ab’s. Immunoprecipitated proteins were subjected to SDS-PAGE and transferred onto membranes for subsequent anti-phosphotyrosine (anti-pTyr) immunoblotting. All blots were subsequently stripped of anti-pTyr Ab’s and reprobed with the precipitating Ab’s to verify equivalent amounts of proteins in each lane. Each lane represents results from individual mice but represents results obtained with at least six sets of mice. (c) Constitutive Lyn kinase activity in B cells. Splenic B cells were solubilized and immunoprecipitated with anti-Lyn Ab. Immunoprecipitates were then incubated with cdc2(–20)NH2 peptide and [γ-32P] ATP. The radioactivity incorporated into cdc2 peptide was quantified by scintillation counting. Relative mean (± SEM) kinase activities are obtained from three experiments. Kinase activity was shown as percentage of wild-type B cells that were defined as 100%. *P < 0.05.
Figure 2
Figure 2
Activation and proliferation of B cells from TSK/+ and wild-type littermates. (a) [Ca2+]i responses in B cells following CD19 ligation. Splenocytes were loaded with indo-1 AM ester and examined for relative [Ca2+]i levels by flow cytometry after gating on the B220+ population of cells. Anti-CD19 mAb was added at the indicated time (arrow). An increase in the fluorescence ratio indicates an increase in [Ca2+]i. These results represent those obtained in four independent experiments. (b) B cell proliferation in response to anti-IgM Ab’s, LPS, and anti-CD38 mAb. Spleen B cells were cultured for 72 hours with the indicated amounts of anti-IgM Ab’s, LPS, or anti-CD38 mAb. Values represent the mean cpm (± SEM) of labeled thymidine obtained from triplicate cultures. These results represent those obtained in four independent experiments. *P < 0.05.
Figure 3
Figure 3
Cell surface IgM or CD23 expression and B cell development in mutant and wild-type littermates. (a) Representative two-color indirect immunofluorescence staining with flow cytometric analysis of B cells. Values represent the percentage of the total gated lymphoid cell population that falls into the indicated gates. Horizontal dashed lines indicate mean IgM or CD23 expression of wild-type B cells to highlight differences in expression levels. These results represent those obtained with at least six mice of each genotype. (b) Relative cell surface IgM or CD23 densities were determined by comparing mean (± SEM) linear fluorescence intensity channel numbers for immunofluorescence staining between B cells from mice of each genotype (n = 6 for each). *P < 0.05, **P < 0.01 vs. wild-type littermates.
Figure 4
Figure 4
Serum Ig levels in mutant and wild-type littermates. Ig levels were determined by isotype-specific ELISAs. Horizontal bars represent mean Ig levels. Statistical analysis is provided in Results.
Figure 5
Figure 5
Anti–topo I, anti-ssDNA, anti-dsDNA, anti-histone, anti–Fbn-1, and RF Ab levels in sera from mutant and wild-type littermates. Relative autoantibody levels were determined by Ig subclass–specific ELISA. Horizontal bars represent mean autoantibody levels. Values in parentheses represent the dilutions of pooled sera giving half-maximal OD values in autoantigen-specific ELISAs, which were determined by linear regression analysis to generate arbitrary units per milliliter that could be directly compared between each group of mice. Statistical analysis is provided in Results.
Figure 6
Figure 6
Skin fibrosis in dorsal skin from mutant and wild-type littermates. (a) Representative histologic sections stained with hematoxylin and eosin are shown (×40). An asterisk indicates the dermis, and double asterisks show the subcutaneous loose connective tissue layer (i.e., the hypodermis or superficial fascia) beneath the panniculus carnosus (arrow). These results represent those obtained with at least ten mice of each genotype. Skin fibrosis was assessed by quantitatively measuring hypodermal thickness (b) and skin hydroxyproline content (c). The hypodermal thickness was measured under a light microscope as the thickness of the hypodermis or superficial fascia beneath the panniculus carnosus. The quantity of hydroxyproline is expressed as μg per 6-mm punch biopsy. Horizontal bars represent mean hypodermal thickness (b) and mean hydroxyproline content (c). Statistical analysis is provided in Results.
Figure 7
Figure 7
Hyperresponsiveness of B cells from TSK/+ mice. (a) IL-6 production by B cells from mutant and wild-type littermates. Spleen B cells were stimulated with either media alone or anti-IgM plus anti-CD40 mAb’s for 48 hours. (b) IgG1 secretion by B cells stimulated with IL-4. Spleen B cells were cultured with either media alone or IL-4 plus LPS for 5 days. Cell supernatants were analyzed by ELISA to determine the amount of secreted IL-6 or IgG1. Each histogram shows the mean (± SD) results obtained for six mice of each genotype. *P < 0.05.

References

    1. Bona C, Rothfield N. Autoantibodies in scleroderma and tightskin mice. Curr Opin Immunol. 1994;6:931–937. - PubMed
    1. Murai C, Saito S, Kasturi KN, Bona CA. Spontaneous occurrence of anti-fibrillin-1 autoantibodies in tight-skin mice. Autoimmunity. 1998;28:151–155. - PubMed
    1. Tan FK, et al. Autoantibodies to the extracellular matrix microfibrillar protein, fibrillin-1, in patients with scleroderma and other connective tissue diseases. J Immunol. 1999;163:1066–1072. - PubMed
    1. Green MC, Sweet HO, Bunker LE. Tight-skin, a new mutation of the mouse causing excessive growth of connective tissue and skeleton. Am J Pathol. 1976;82:493–512. - PMC - PubMed
    1. Siracusa LD, et al. A tandem duplication within the fibrillin 1 gene is associated with the mouse tight skinmutation. Genome Res. 1996;6:300–131. - PubMed

Publication types

MeSH terms