. 2002 Jun 11;99(12):8366-71.
doi: 10.1073/pnas.122210599. Epub 2002 Jun 4.

Dendritic K+ channels contribute to spike-timing dependent long-term potentiation in hippocampal pyramidal neurons

Affiliations

Dendritic K+ channels contribute to spike-timing dependent long-term potentiation in hippocampal pyramidal neurons

Shigeo Watanabe et al. Proc Natl Acad Sci U S A. .

Abstract

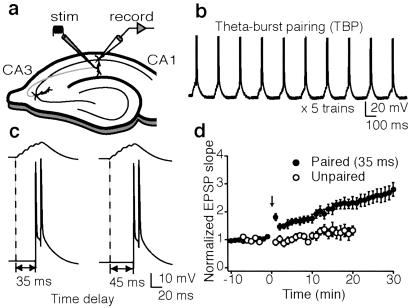
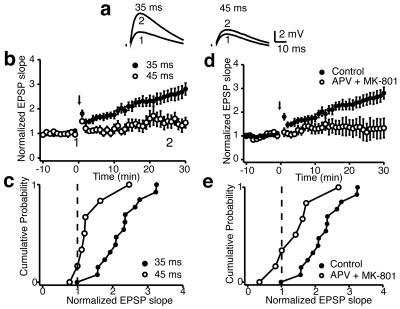
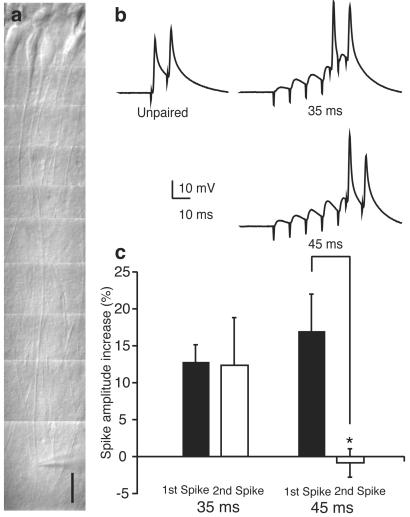
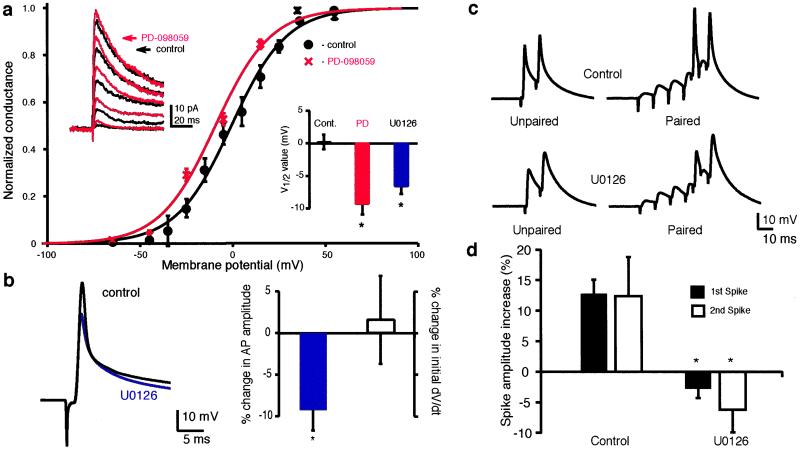
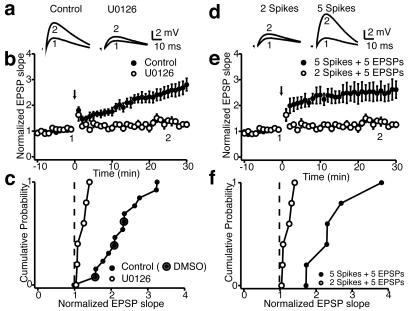
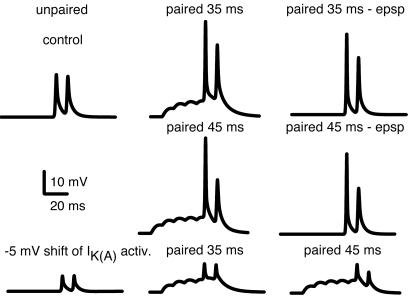
We investigated the role of A-type K(+) channels for the induction of long-term potentiation (LTP) of Schaffer collateral inputs to hippocampal CA1 pyramidal neurons. When low-amplitude excitatory postsynaptic potentials (EPSPs) were paired with two postsynaptic action potentials in a theta-burst pattern, N-methyl-d-aspartate (NMDA)-receptor-dependent LTP was induced. The amplitudes of the back-propagating action potentials were boosted in the dendrites only when they were coincident with the EPSPs. Mitogen-activated protein kinase (MAPK) inhibitors PD 098059 or U0126 shifted the activation of dendritic K(+) channels to more hyperpolarized potentials, reduced the boosting of dendritic action potentials by EPSPs, and suppressed the induction of LTP. These results support the hypothesis that dendritic K(+) channels and the boosting of back-propagating action potentials contribute to the induction of LTP in CA1 neurons.


Figures

Figure 1
Figure 1
Pairing of subthreshold synaptic stimulation and action potential trains induces LTP. (a) Schematic of a hippocampal slice showing stimulating (stim) and recording (record) sites. (b) A representative response evoked by one train of LTP induction protocol (five trains, given every 15 s, each consisting of ten bursts of synaptic stimuli at 5 Hz with back-propagating action potential, each burst consisting of five subthreshold synaptic stimuli at 100 Hz and two action potentials at 100 Hz.) (c) Representative traces of subthreshold synaptic response and current-induced back-propagating action potential at a faster time scale. Time delay is defined as the delay between the onset of synaptic input and the first action potential. (d) Time course and magnitude of potentiation evoked by pairing (35-ms time delay) and unpairing protocols. The magnitude of LTP induced with 35-ms time delay differed significantly from the potentiation evoked by unpaired protocol [35-ms time delay, 221% ± 17%, n = 14; 1-min time delay (unpaired), 129% ± 23%, n = 6, P < 0.01; both are averages measured at 15–17 min after TBP]. These LTP experiments were done in a saline solution (see Materials and Methods) with and without 0.2% DMSO. Because there was no significant difference in the magnitude of LTP between the two groups (LTP without DMSO, 227% ± 21%, n = 11; LTP with DMSO, 200% ± 23%, n = 3, P > 0.1), the data were grouped together into the control group.
Figure 2
Figure 2
LTP induction depends on the timing between subthreshold synaptic stimulation and postsynaptic action potentials. (a) Representative EPSP responses before (trace 1) and 25 min after (trace 2) TBP. LTP induced with a 35-ms delay is of significantly greater magnitude than with a 45-ms delay. (b) Time course and magnitude of potentiation evoked by the different time delay stimulation protocols. The magnitude of synaptic response change induced with a 35-ms time delay protocol differed significantly from synaptic response change with a 45-ms time delay protocol (35-ms time delay, 221% ± 17%, n = 14; 45-ms time delay, 135% ± 21%, n = 7, P < 0.01). (c) Cumulative probability plots graphically summarize the data. Each point represents the magnitude of change relative to baseline for a given experiment 15–17 min (average) after TBP (probability of 50% long-term change in EPSP with 35-ms time delay, 93%, with 45-ms time delay, 29%). (d) NMDA-receptor antagonists APV (50 μM) and MK-801 (20 μM) suppressed potentiation elicited with the 35-ms protocol compared with control (221% ± 17%, n = 14, and 138% ± 28%, n = 7, respectively; P < 0.05). (e) Cumulative probability for control and drug-treated slices (probability of 150% LTP was 43%).
Figure 3
Figure 3
Boosting of dendritic action potential amplitude paired by subthreshold synaptic response depends on pairing timing. (a) IR-differential interference contrast image of CA1 pyramidal neuron and recording site in the dendrites. (Bar = 20 μm.) (b) Representative membrane voltage traces from dendritic recording. (c) Summary of change in the amplitude of back-propagating action potential paired with EPSPs. There was a supralinear increase in the amplitude of both the first and second action potentials with the 35-ms protocol but only in the first action potential with the 45-ms paradigm (35 ms: first spike 12.8% ± 2.3%, second spike 12.4% ± 6.4%, n = 7, both different from unpaired, P < 0.0009 and P < 0.017, respectively; 45 ms: first spike 17.0% ± 5%, different from unpaired, P < 0.0008, second spike −0.87% ± 1.9%, not different from unpaired, P = 0.4, n = 7; difference between first spike and second spike, P < 0.01). The amplitude was normalized by the amplitude of unpaired back-propagating action potentials.
Figure 4
Figure 4
Inhibition of basal MAPK activity shifts the K+-channel activation curve, up-regulates dendritic K+ currents, decreases the amplitude of back-propagating action potentials, and decreases the boosting of dendritic action potential amplitude when paired with subthreshold synaptic responses. (a) Steady-state, transient K+ current activation curves for control and 50 μM PD 098059. Half-activation with PD 098059 (V1/2 = −9 mV, n = 7) was shifted 7 mV in the hyperpolarizing direction compared with controls (V1/2 = −2 mV, n = 10, P < 0.0005). In six of seven recordings, PD 098059 was applied to the slice at least 20 min before recording; in one case it was washed in subsequent to construction of a control-activation curve. (Left Inset) Family of total outward currents for the experiment where PD 098059 was washed in after recording the control activation curves. Control (black) traces show less transient current at all potentials compared with traces in PD 098059 (red traces). (Right Inset) Summary data for change in V1/2 for all experiments. Similar results were obtained with another MEK inhibitor, U0126 (20 μM). Half-activation with U0126 (V1/2 = −7 mV, n = 9) was also shifted hyperpolarized as compared with controls (V1/2 = −2 mV, n = 10, P < 0.0005). In six of the nine experiments, U0126 was included in the patch pipette, in the other three it was applied to the slice at least 20 min before recording. (b) Antidromic action potentials (Left) recorded in the dendrites about 180 μm from the soma before and after applying 20 μM U0126. Summary data for change in amplitude and initial rate of rise are shown on the right (decrease in amplitude = 9.3% ± 2.4%, P < 0.003; change in initial dV/dt = 1.6% ± 5.3%, P = 0.18, n = 17). In some experiments, 1 μM 1,2,3,4-tetrahydro-6-nitro-2,3-dioxo-benzo[f]quinoxaline-7-sulfonamide (NBQX) and 50 μM APV were included in the bath to avoid antidromically activated EPSPs. Experiments were done with both potassium gluconate and KMeSO4-based pipette solutions with similar results (see Materials and Methods). (c) Representative membrane potential traces from dendritic recordings in control (Upper) and in a slice pretreated with U0126 (Lower). (d) Summary of the effects of U0126 on the amplitude of back-propagating action potential paired with EPSPs (Control: first spike 12.8% ± 2.3%, second spike 12.4% ± 6.4%; U0126: first spike −2.8% ± 1.5%, second spike −6.2% ± 3.7%, n = 5, both different from control, P < 0.00025 and 0.033, respectively; neither different from unpaired in U0126, P = 0.22 and 0.11, respectively). The amplitude was normalized by the amplitude of unpaired back-propagating action potentials.
Figure 5
Figure 5
Effects of MEK inhibitor U0126 on the induction of LTP with TBP. (a) Representative synaptic responses before (trace 1) and 25 min after TBP (trace 2) in control condition and in the presence of U0126 (20 μM). Significantly less potentiation occurred in the presence of U0126. (b) Summary data from all experiments. U0126 suppressed the induction of LTP by the 35-ms time delay TBP (control, 221% ± 17%, n = 14; U0126, 122% ± 6%, n = 6, P < 0.0001). (c) Cumulative probability plots summarize the suppression of LTP by U0126 using the 35-ms protocol. (d) Representative synaptic responses before (trace 1) and 25 min after TBP (trace 2) in which two spikes or five spikes were paired with EPSPs in the presence of U0126 (20 μM). (e) U0126 did not suppress the induction of LTP by TBP in which five spikes instead of two were paired with EPSPs (two spikes paired with five EPSPs, 122% ± 6%, n = 6; five spikes paired with five EPSPs, 243% ± 32%, n = 6, P < 0.012). (f) Cumulative probability plot summarizes the suppression of LTP by U0126 for the five-spike and two-spike protocols. Probability of LTP (defined as a 50% increase in averaged response amplitude 15–17 min after pairing) was 0% with two spikes and 100% with five spikes.
Figure 6
Figure 6
Computer model for EPSP-induced spike boosting. All traces show membrane potential of a distal dendritic compartment (340 μm from the soma). Each synaptic stimulus was modeled as an alpha function with peak conductance of 1.5 nS, time constant of 6 ms, and reversal potential of 0 mV. (Top) Two somatic action potentials were elicited at 100 Hz unpaired (left trace) or paired (center trace) with a burst of five subthreshold synaptic stimuli at 100 Hz with a relative time delay of 35 ms. For comparison purposes, the result obtained in the paired case is shown after subtraction of the depolarization induced by the EPSPs (right trace). (Middle) As in top traces, but with somatic action potentials elicited with a relative time delay of 45 ms. (Bottom) Effects of a −5-mV shift in the activation curve for the dendritic transient K+ conductance. Membrane potential is shown when back-propagating action potentials were unpaired (left trace) or paired with synaptic stimuli with a relative time delay of 35 ms (center trace) or 45 ms (right trace).

Similar articles

Cited by

References

    1. Magee J C, Johnston D. Science. 1997;275:209–213. - PubMed
    1. Johnston D, Hoffman D A, Magee J C, Poolos N P, Watanabe S, Colbert C M, Migliore M. J Physiol (London) 2000;525:75–81. - PMC - PubMed
    1. Cain D P. Curr Opin Neurobiol. 1997;7:235–242. - PubMed
    1. Murphy K P, Reid G P, Trentham D R, Bliss T V P. J Physiol (London) 1997;504:379–385. - PMC - PubMed
    1. Markram H, Lübke J, Frotscher M, Sakmann B. Science. 1997;275:213–215. - PubMed

Publication types

MeSH terms

LinkOut - more resources