. 2002 Jun 1;16(11):1345-55.
doi: 10.1101/gad.992302.

ASK1 is essential for endoplasmic reticulum stress-induced neuronal cell death triggered by expanded polyglutamine repeats

Affiliations

ASK1 is essential for endoplasmic reticulum stress-induced neuronal cell death triggered by expanded polyglutamine repeats

Hideki Nishitoh et al. Genes Dev. .

Abstract

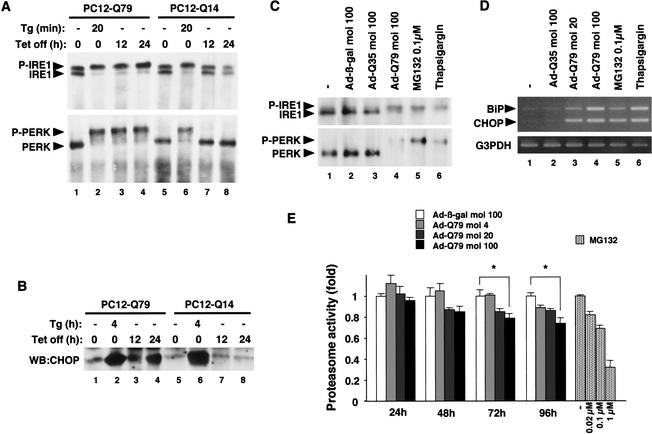
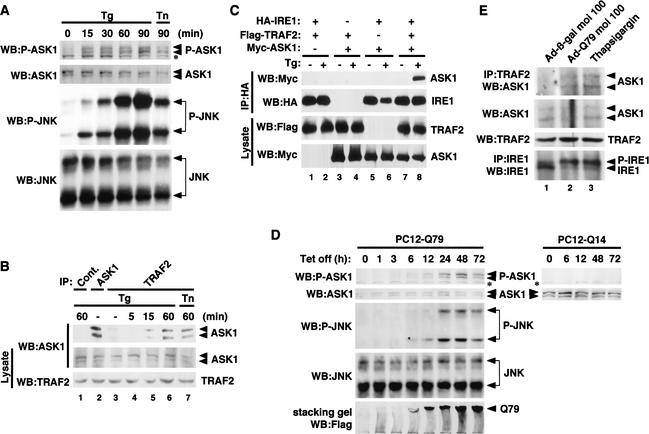
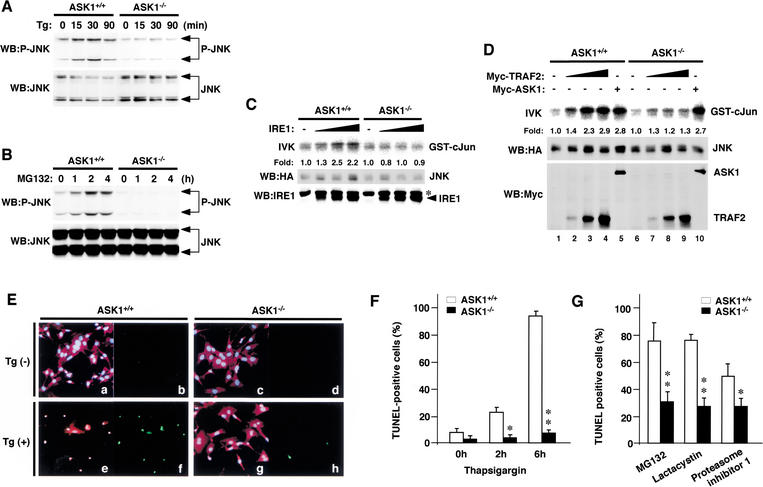
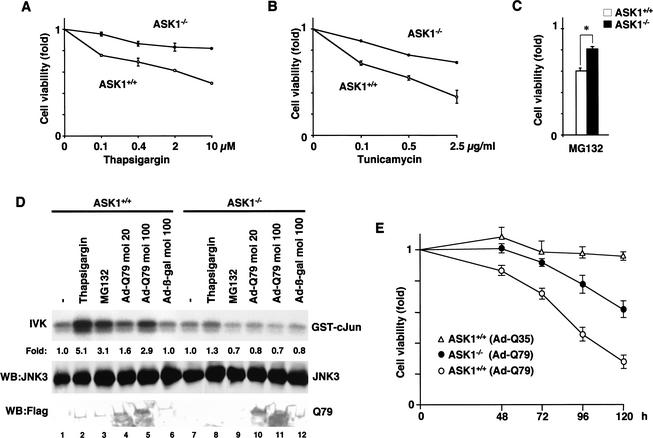
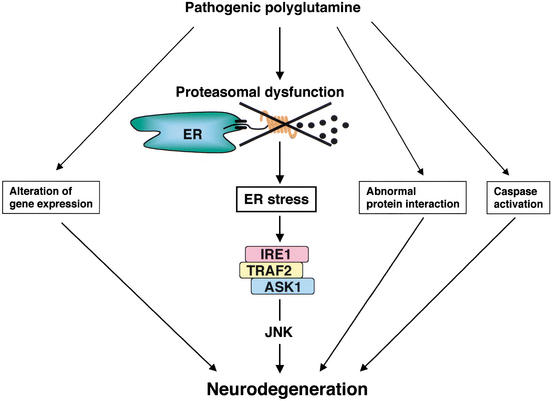
Expansion of CAG trinucleotide repeats that encode polyglutamine is the underlying cause of at least nine inherited human neurodegenerative disorders, including Huntington's disease and spinocerebellar ataxias. PolyQ fragments accumulate as aggregates in the cytoplasm and/or in the nucleus, and induce neuronal cell death. However, the molecular mechanism of polyQ-induced cell death is controversial. Here, we show the following: (1) polyQ with pathogenic repeat length triggers ER stress through proteasomal dysfunction; (2) ER stress activates ASK 1 through formation of an IRE1-TRAF2-ASK1 complex; and (3) ASK1(-/-) primary neurons are defective in polyQ-, proteasome inhibitor-, and ER stress-induced JNK activation and cell death. These findings suggest that ASK1 is a key element in ER stress-induced cell death that plays an important role in the neuropathological alterations in polyQ diseases.


Figures

Figure 1
Figure 1
Expanded polyQ triggers ER stress through proteasomal dysfunction. (A) Activation of endogenous IRE1 and PERK by Q79. PC12-Q79 and PC12-Q14 cells (5 × 106 each) were lysed at each time point after treatment with 2 μM thapsigargin (Tg) or removal of Tet, and analyzed by immunoprecipitation (IP)-immunoblotting (WB) with anti-IRE1α and anti-PERK antisera. (P-IRE1) Autophosphorylated IRE1; (P-PERK) autophosphorylated PERK. (B) Induction of CHOP by Q79. PC12-Q79, and PC12-Q14 cells (1 × 106 each) were lysed with RIPA buffer at each time point after treatment with 2 μM thapsigargin (Tg) or removal of Tet, and analyzed by WB with anti-CHOP antiserum. (C) Activation of IRE1 and PERK by Q79 and proteasome inhibitor in primary neurons. Primary neurons (1 × 106) derived from day 14.5 mouse embryos were infected with the indicated m.o.i. of Ad-β-gal, Ad-Q35, or Ad-Q79 for 48 h, or treated with 0.1 μM MG132 for 48 h or with 2 μM thapsigargin for 1 h. Cell lysates were analyzed by IP–WB with anti-IRE1α and anti-PERK antisera. (D) Induction of BiP and CHOP mRNA by Q79 and proteasome inhibitor in primary neurons. Results of RT–PCR following infection with the indicated m.o.i. of Ad-Q35 and Ad-Q79 for 48 h or treatments with MG132 (0.1 μM for 48 h) and thapsigargin (2 μM for 1 h). Expression of G3PDH was examined as a quantity control (bottom). (E) Inhibition of proteasomal activity by Q79. Primary neurons were infected with the indicated m.o.i. of Ad-β-gal or Ad-Q79 for the indicated time periods, or treated with the indicated concentration of MG132 for 1 h. The proteasomal activity was measured as described in Materials and Methods and is shown as fold increase relative to that of Ad-β-gal-infected (for Ad-Q79) or untreated (for MG132) cells. Data are means (±SE) of three independent experiments derived from independent embryos. (*) P < 0.05 relative to control; significance calculated by Student's t-test.
Figure 2
Figure 2
Expanded polyQ activates the IRE1–TRAF2–ASK1–JNK pathway. (A) ER stress-induced activation of ASK1–JNK pathway. PC12 cells (1 × 106) were treated with 20 μM thapsigargin (Tg) or 10 μg/mL tunicamycin (Tn) for the indicated time periods. Cells were then lysed and immunoblotted with antibodies to phospho-ASK1 (P-ASK1) and phospho-JNK (P-JNK). Membranes were reprobed with antibodies to ASK1 and JNK as loading controls. The asterisk in the phospho-ASK1 panel denotes a nonspecific band detected. (B) ER stress-dependent endogenous interaction between ASK1 and TRAF2 in PC12 cells. Cell lysates from PC12 cells treated with 20 μM thapsigargin or 10 μg/mL tunicamycin for the indicated time periods were immunoprecipitated with anti-TRAF2 (IP: TRAF2), anti-ASK1 (IP: ASK1), or nonimmune antiserum (IP: Cont.). Coimmunoprecipitated ASK1 with TRAF2 was detected by immunoblotting with anti-ASK1. Presence of ASK1 and TRAF2 was confirmed by immunoblotting using the same lysates. (C) ER stress-induced IRE1–TRAF2–ASK1 complex in transfected 293 cells. The 293 cells were transiently transfected with pcDNA3–HA–IRE1β (1.2 μg), pcDNA3–Flag–TRAF2 (0.3 μg) and pcDNA3–myc–ASK1 (0.5 μg) in the indicated combinations. After 12 h, cells were treated with 20 μM thapsigargin for 20 min, immunoprecipitated with anti-HA (12CA5), and immunoblotted (WB) with anti-myc (9E10) and anti-HA (3F10) antibodies. The appropriate expressions of Flag–TRAF2 and Myc–ASK1 were confirmed in the same lysates. (D) Activation of ASK1–JNK pathway by pathogenic polyQ. PC12-Q79 and PC12-Q14 cells were lysed at each time point after removal of Tet and analyzed by immunoblotting with antibodies to phospho-ASK1 (P-ASK1) and phospho-JNK (P-JNK). Membranes were reprobed with antibodies to ASK1 or JNK as loading controls. The asterisk in the phospho-ASK1 panel denotes a nonspecific band. Expression of Flag–Q79 was verified by immunoblotting with anti-Flag antibody. Immunoreactive bands of Q79 were detected at the top of the stacking gel accompanied by a smearing pattern (bottom). (E) PolyQ-dependent endogenous interaction between ASK1 and TRAF2 in primary neurons. Cell lysates from primary neurons (1 × 107), infected with Ad-β-gal or Ad-Q79 at m.o.i. 100 for 48 h, or treated with 20 μM thapsigargin for 20 min, were immunoprecipitated with anti-TRAF2 (IP: TRAF2). Coimmunoprecipitated ASK1 with TRAF2 was detected by immunoblotting with anti-ASK1. Activation of IRE1 was confirmed by IP–WB with anti-IRE1α antiserum using the same lysates (bottom). (P-IRE1) Autophosphorylated IRE1.
Figure 3
Figure 3
Requirement of ASK1 for ER stress- and proteasome inhibitor-induced JNK activation and cell death in MEFs. Lack of JNK activation by thapsigargin (A) and MG132 (B) in ASK1−/− MEFs. ASK1+/+ and ASK1−/− MEFs were treated with 2 μM thapsigargin (Tg) or 10 μM MG132 for the indicated time periods, and JNK activation was analyzed by the phospho-JNK immunoblot as described in Fig. 2A. Lack of JNK activation by IRE1 (C) and TRAF2 (D) in ASK1−/− MEFs. pcDNA3–HA–JNK (15 μg) was transiently transfected with pBabe-IRE1β (3, 7.5, and 15 μg), pcDNA3–myc–TRAF2 (1, 2.5, and 5 μg) or pcDNA3–myc–ASK1 (15 μg) into ASK1+/+ and ASK1−/− MEFs. After 48 h, JNK was immunoprecipitated by anti-HA and subjected to immunecomplex kinase assay as described in Materials and Methods. (Top) In vitro kinase assay (IVK) for JNK activity. Expressions of HA–JNK, IRE1β, and myc–TRAF2 were confirmed. Kinase activity relative to amount of JNK protein was calculated, and activity is shown as fold increase relative to that of HA–JNK from TRAF2-, ASK1-, and IRE1-negative cells. The asterisk in the IRE1 panel denotes a nonspecific reaction. (E) Lack of ER stress-induced apoptosis in ASK1−/− MEFs. Cell morphology (a,c,e,g) was analyzed by fluorescence double staining with Hoechst 33258 (blue) and PI (red) of MEFs that were either treated (e,g) or untreated (a,c) with 3 μM of thapsigargin (Tg) for 6 h. TUNEL staining (green: b,d,f,h) of the same fields is shown. (F) Time-course analysis of ER stress-induced apoptosis in ASK1−/− MEFs. ASK1+/+ MEFs (open bars) and ASK1−/− MEFs (solid bars) were treated with 3 μM thapsigargin for the indicated periods. The percentage of TUNEL-positive cells in the total cell counts stained with Hoechst 33258 is shown. At least 300 cells per coverslip were counted. Data are means (±SE) of three independent experiments. (*) P < 0.05; (**) P < 0.01 relative to control; significance calculated by Student's t-test. (G) Lack of proteasome inhibitor-induced apoptosis in ASK1−/− MEFs. MEFs were treated with 10 μM MG132, 10 μM Lactacystin, or 10 μM Proteasome inhibitor I for 16 h. The percentage of TUNEL-positive cells was counted as described in F.
Figure 4
Figure 4
Requirement of ASK1 for ER stress-, proteasome inhibitor-, and polyQ-induced JNK activation and cell death in neurons. (A,B) Lack of ER stress-induced cell death in ASK1−/− primary neurons. ASK1+/+ neurons (○) and ASK1−/− neurons (●) were treated with the indicated concentration of thapsigargin or tunicamycin for 16 h. The graphs show the cell viability determined by MTT assay as described in Materials and Methods. (C) Reduction of proteasome inhibitor-induced cell death in ASK1−/− primary neurons. ASK1+/+ neurons (open bar) and ASK1−/− neurons (solid bar) were treated with 0.1 μM MG132 for 16 h. The graph shows the cell viability determined by MTT assay. Data are means (± SE) of three independent experiments derived from independent embryos (A–C). (*) P < 0.05 relative to control; significance calculated by Student's t-test. (D) Lack of polyQ-, proteasome inhibitor-, and ER stress-induced JNK activation in ASK1−/− primary neurons. ASK1+/+ neurons and ASK1−/− neurons were infected with the indicated m.o.i. of Ad-β-gal or Ad-Q79 for 48 h, or treated with 2 μM thapsigargin for 30 min, or 10 μM MG132 for 2 h. JNK3 was immunoprecipitated by anti-JNK3 monoclonal antibody and subjected to immunecomplex kinase assay as described in Materials and Methods. (Top) IVK for JNK3 activity. Expressions of JNK3 (middle) and Flag-Q79 (bottom) in the same lysate are shown. Kinase activity relative to the amount of JNK3 protein was calculated, and activity is shown as fold increase relative to that of JNK3 from unstimulated cells. (E) Time-course analysis of polyQ-induced cell death in ASK1+/+ and ASK1−/− primary neurons. ASK1+/+ neurons (○, ▵) and ASK1−/− neurons (●) were infected with Ad-Q79 or Ad-Q35 at m.o.i. 100 for the indicated time periods. The graph shows the cell viability determined by MTT assay as described in Materials and Methods. Data are means (±SE) of 10 independent experiments derived from independent embryos.
Figure 5
Figure 5
Schematic representation of the role of IRE1–TRAF2–ASK1 cascade in the pathogenesis of polyQ disease. See text for details.

References

    1. Bence NF, Sampat RM, Kopito RR. Impairment of the ubiquitin-proteasome system by protein aggregation. Science. 2001;292:1552–1555. - PubMed
    1. Bertolotti A, Zhang Y, Hendershot LM, Harding HP, Ron D. Dynamic interaction of BiP and ER stress transducers in the unfolded-protein response. Nat Cell Biol. 2000;2:326–332. - PubMed
    1. Bush KT, Goldberg AL, Nigam SK. Proteasome inhibition leads to a heat-shock response, induction of endoplasmic reticulum chaperones, and thermotolerance. J Biol Chem. 1997;272:9086–9092. - PubMed
    1. Delepine M, Nicolino M, Barrett T, Golamaully M, Lathrop GM, Julier C. EIF2AK3, encoding translation initiation factor 2-α kinase 3, is mutated in patients with Wolcott-Rallison syndrome. Nat Genet. 2000;25:406–409. - PubMed
    1. DiFiglia M, Sapp E, Chase KO, Davies SW, Bates GP, Vonsattel JP, Aronin N. Aggregation of huntingtin in neuronal intranuclear inclusions and dystrophic neurites in brain. Science. 1997;277:1990–1993. - PubMed

Publication types

MeSH terms