

Gene expression profiles derived from fine needle aspiration correlate with response to systemic chemotherapy in breast cancer
- PMID: 12052255
- PMCID: PMC111028
- DOI: 10.1186/bcr433
Gene expression profiles derived from fine needle aspiration correlate with response to systemic chemotherapy in breast cancer
Abstract
Background: Drug resistance in breast cancer is a major obstacle to successful chemotherapy. In this study we used cDNA microarray technology to examine gene expression profiles obtained from fine needle aspiration (FNA) of primary breast tumors before and after systemic chemotherapy. Our goal was to determine the feasibility of obtaining representative expression array profiles from limited amounts of tissue and to identify those expression profiles that correlate with treatment response.
Methods: Repeat presurgical FNA samples were taken from six patients who were to undergo primary surgical treatment. Additionally, a group of 10 patients who were to receive neoadjuvant chemotherapy underwent two FNAs before chemotherapy (adriamycin 60 mg/m2 and cyclophosphamide 600 mg/m2) followed by another FNA on day 21 after the first cycle. Total RNA was amplified with T7 Eberwine's procedure and labeled cDNA was hybridized onto a 7600-feature glass cDNA microarray.
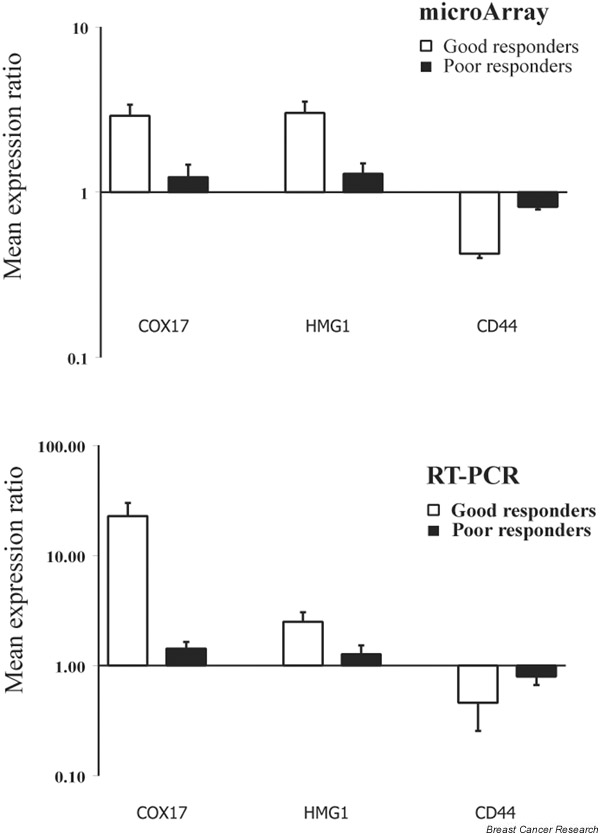
Results: We identified candidate gene expression profiles that might distinguish tumors with complete response to chemotherapy from tumors that do not respond, and found that the number of genes that change after one cycle of chemotherapy was 10 times greater in the responding group than in the non-responding group.
Conclusion: This study supports the suitability of FNA-derived cDNA microarray expression profiling of breast cancers as a comprehensive genomic approach for studying the mechanisms of drug resistance. Our findings also demonstrate the potential of monitoring post-chemotherapy changes in expression profiles as a measure of pharmacodynamic effect and suggests that these approaches might yield useful results when validated by larger studies.
Figures


References
-
- Early Breast Cancer Trialists' Collaborative Group Polychemotherapy for early breast cancer: an overview of the randomised trials. Lancet. 1998;352:930–942. - PubMed
-
- Chang J, Powles TJ, Allred DC, Ashley SE, Clark GM, Makris A, Assersohn L, Gregory RK, Osborne CK, Dowsett M. Biologic markers as predictors of clinical outcome from systemic therapy for primary operable breast cancer. J Clin Oncol. 1999;17:3058–3063. - PubMed
-
- Ellis PA, Smith IE, McCarthy K, Detre S, Salter J, Dowsett M. Pre-operative chemotherapy induces apoptosis in early breast cancer. Lancet. 1997;349:849. - PubMed
-
- Chang J, Ormerod M, Powles TJ, Allred DC, Ashley SE, Dowsett M. Apoptosis and proliferation as predictors of chemotherapy response in patients with breast carcinoma. Cancer. 2000;89:2145–2152. - PubMed
-
- Gruvberger S, Ringner M, Chen Y, Panavally S, Saal LH, Borg A, Ferno M, Peterson C, Meltzer PS. Estrogen receptor status in breast cancer is associated with remarkably distinct gene expression patterns. Cancer Res. 2001;61:5979–5984. - PubMed
Publication types
MeSH terms
Substances
LinkOut - more resources
Full Text Sources
Other Literature Sources
Medical
