. 2002 Jun;13(6):1977-2000.
doi: 10.1091/mbc.02-02-0030.

Identification of genes periodically expressed in the human cell cycle and their expression in tumors

Affiliations

Identification of genes periodically expressed in the human cell cycle and their expression in tumors

Michael L Whitfield et al. Mol Biol Cell. 2002 Jun.

Abstract

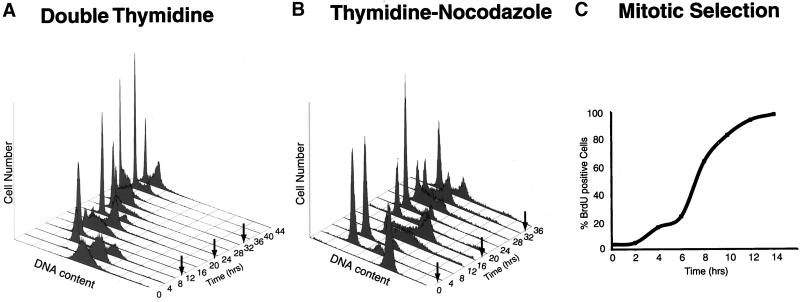
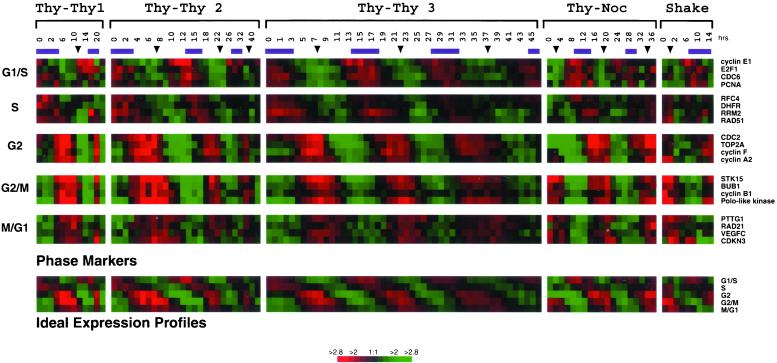
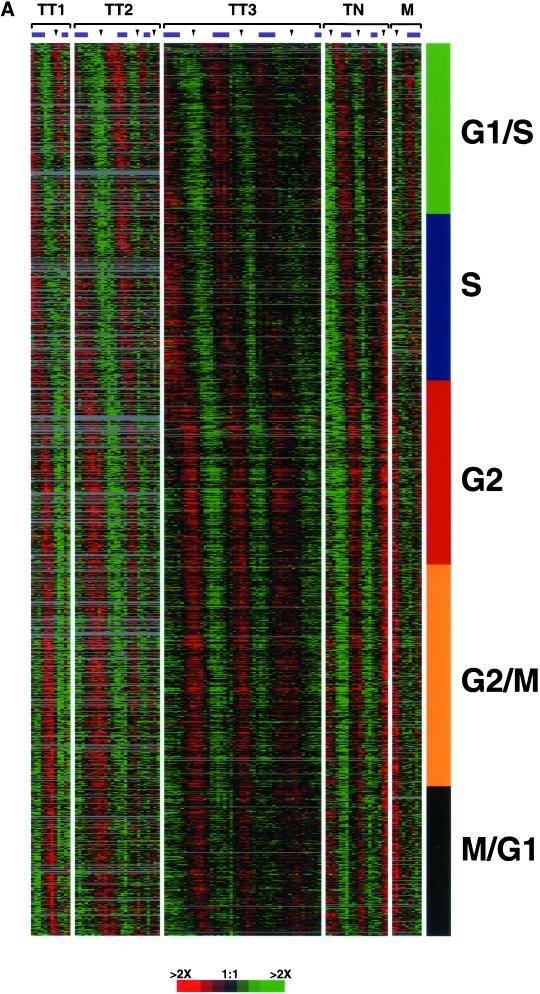
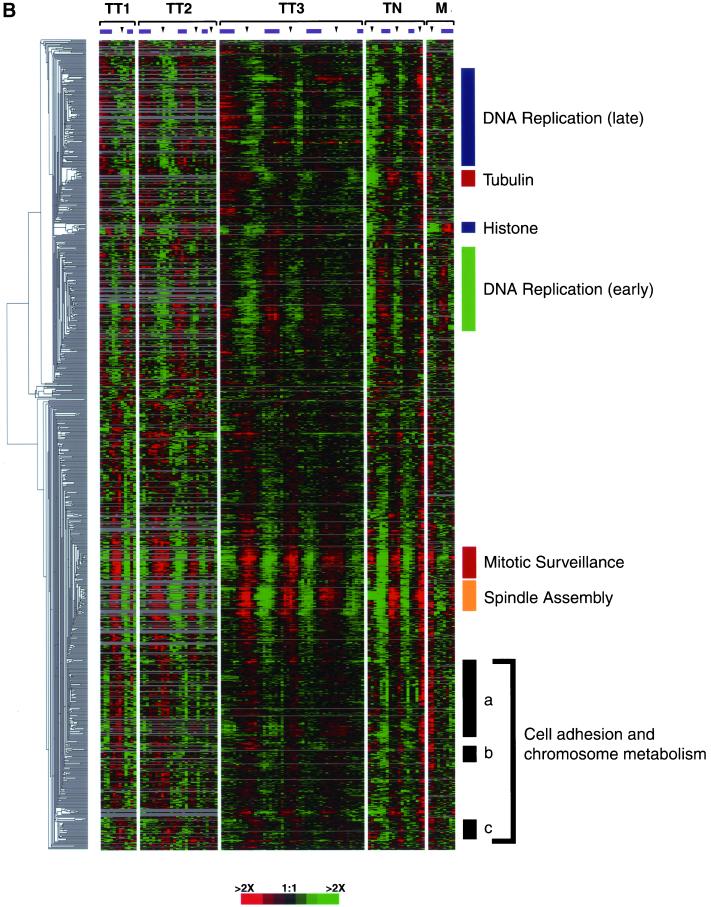
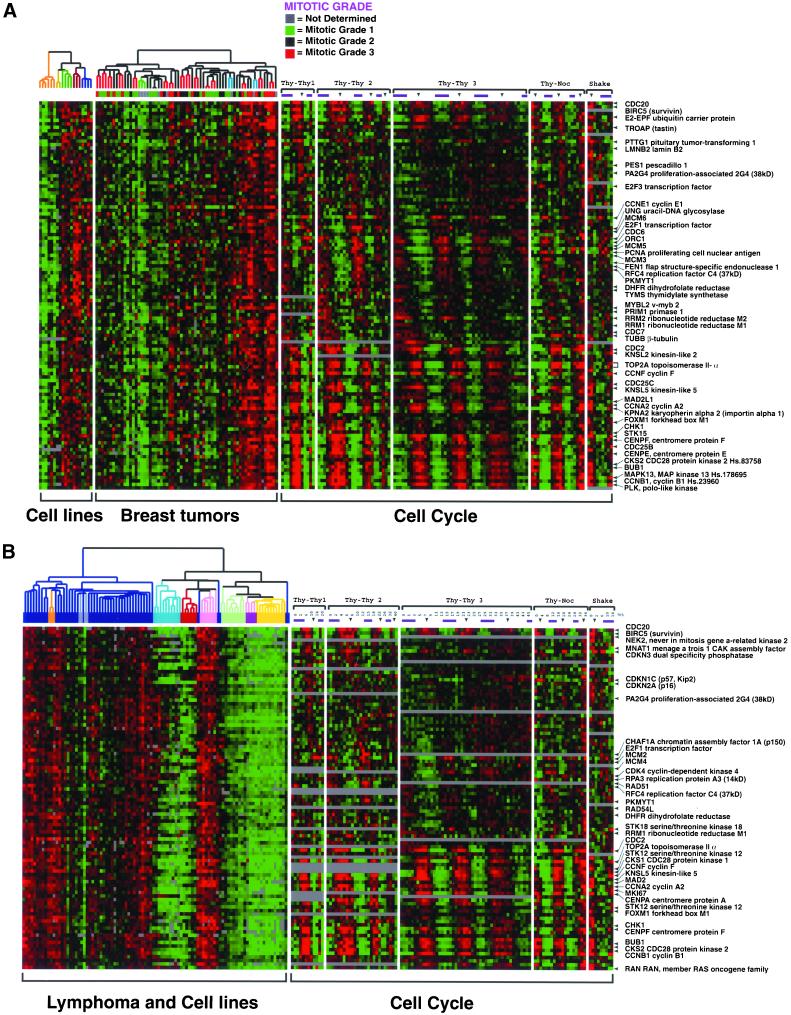
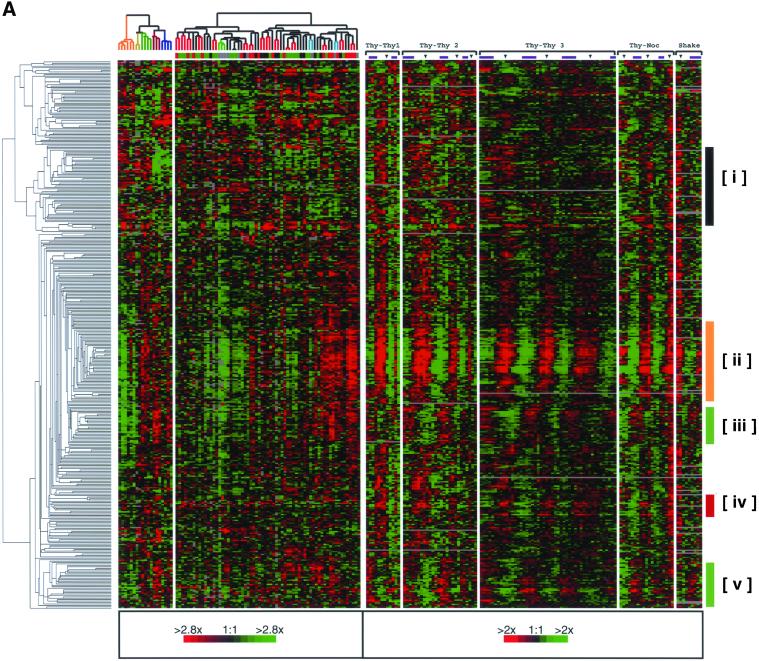
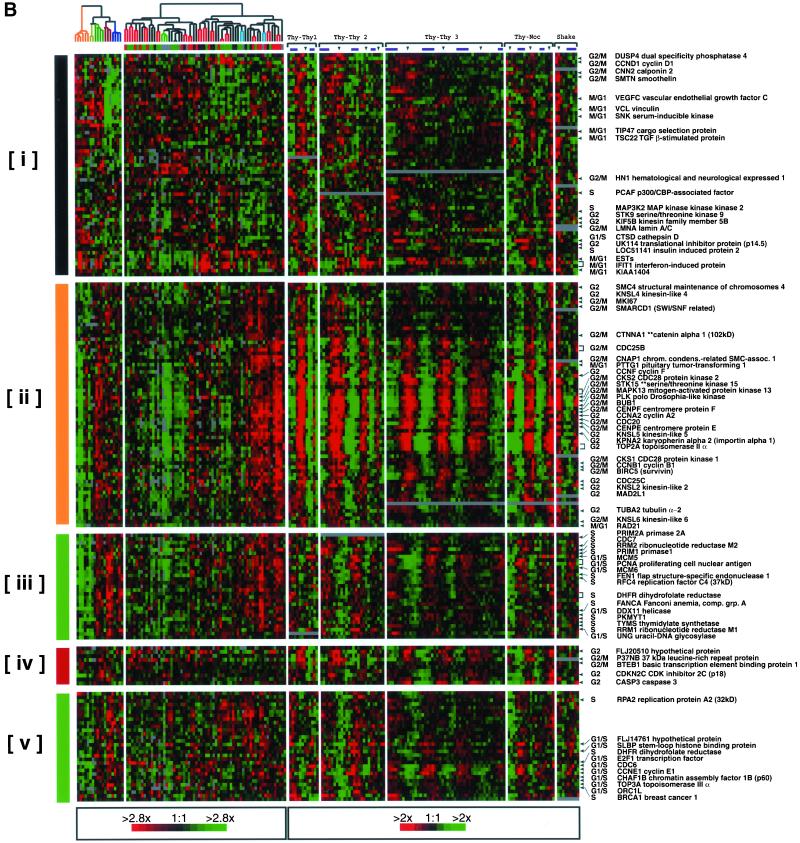
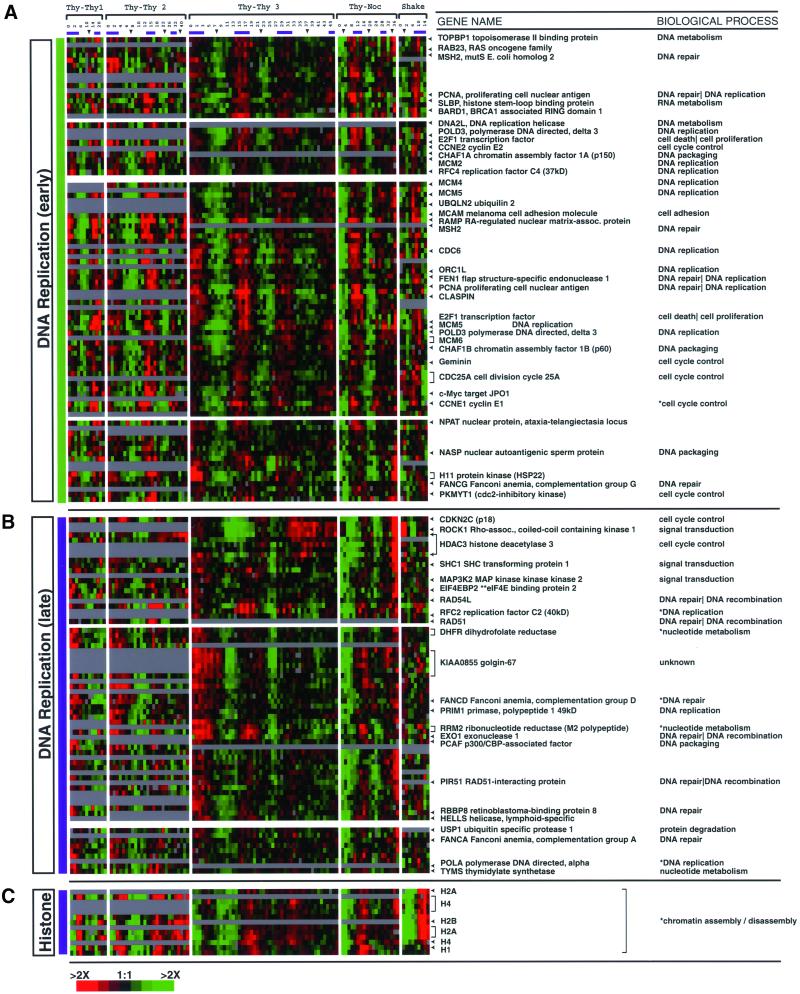
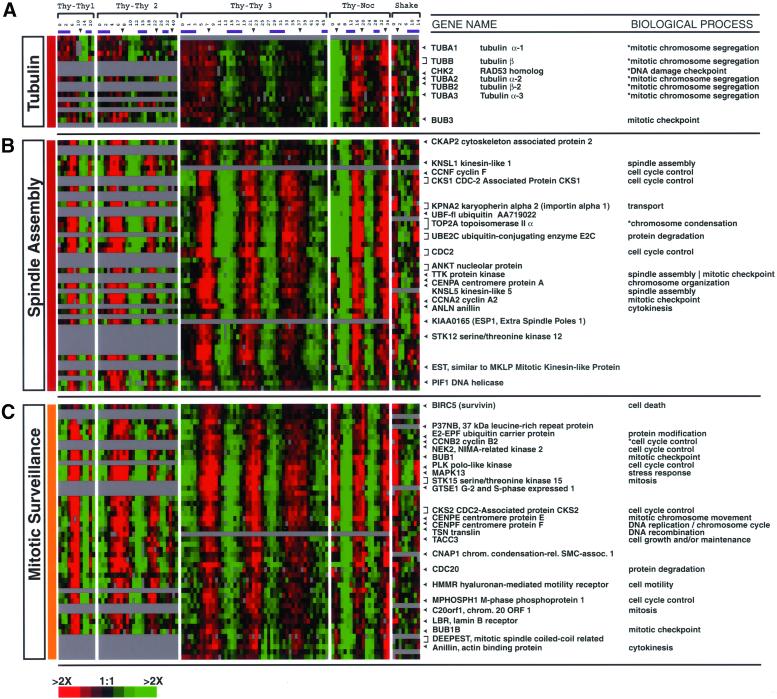
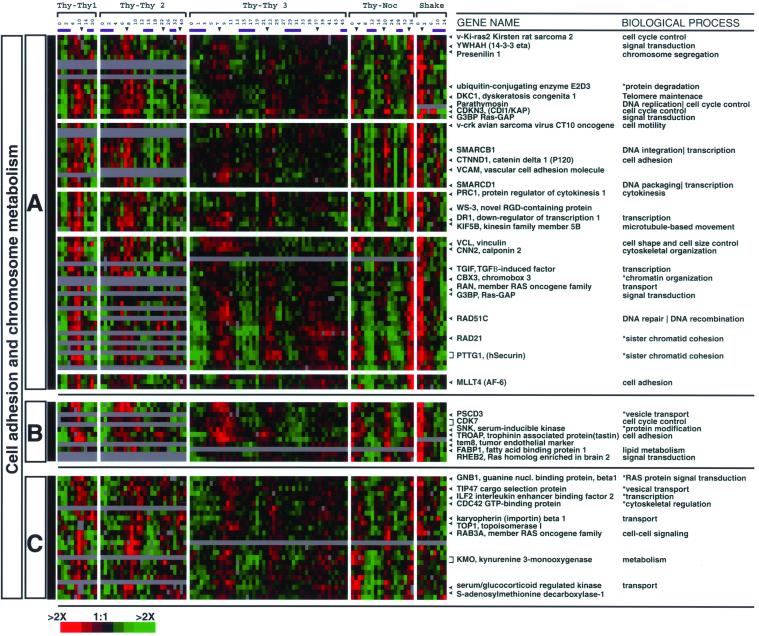
The genome-wide program of gene expression during the cell division cycle in a human cancer cell line (HeLa) was characterized using cDNA microarrays. Transcripts of >850 genes showed periodic variation during the cell cycle. Hierarchical clustering of the expression patterns revealed coexpressed groups of previously well-characterized genes involved in essential cell cycle processes such as DNA replication, chromosome segregation, and cell adhesion along with genes of uncharacterized function. Most of the genes whose expression had previously been reported to correlate with the proliferative state of tumors were found herein also to be periodically expressed during the HeLa cell cycle. However, some of the genes periodically expressed in the HeLa cell cycle do not have a consistent correlation with tumor proliferation. Cell cycle-regulated transcripts of genes involved in fundamental processes such as DNA replication and chromosome segregation seem to be more highly expressed in proliferative tumors simply because they contain more cycling cells. The data in this report provide a comprehensive catalog of cell cycle regulated genes that can serve as a starting point for functional discovery. The full dataset is available at http://genome-www.stanford.edu/Human-CellCycle/HeLa/.


Figures

Figure 1
Figure 1
Synchrony of HeLa cells. (A) Cells were arrested at the beginning of S phase by using a double thymidine block, and cell synchrony was monitored by flow cytometry of propidium iodide-stained cells. Flow cytometry data were collected for each of the three independent double thymidine blocks performed in this study; data are shown only for the second double thymidine arrest (Thy-Thy2), although equivalent synchrony was obtained in each of the three experiments. The number of cells (arbitrary units) is plotted against DNA content for time points at 4-h intervals for 44 h; an arrow indicates the time of mitosis, as estimated from the flow cytometry data. Upon release from the thymidine block, >95% of the cells progressed into S phase (0–4 h), entered G2 phase (5–6 h), underwent a synchronous mitosis at 7–8 h, and reentered S phase after completing one full cell cycle at 14–16 h. Typically two to three additional synchronous cell cycles were obtained. (B) Cells were arrested in mitosis by blocking first in thymidine followed by release and then blocking in nocodazole. After release from the nocodazole block, most of the cells (>75%) divided synchronously within 2 h of release from the arrest, entered S phase by 10–12 h after release, and completed the next synchronous mitosis by 18–20 h, ultimately completing two full cell cycles. (C) Cells were selected by mitotic shake-off, and the percentage of cells in S phase was measured by BrdU incorporation. The percentage of cells in S phase is plotted against the time after plating; >95% of the cells entered S phase by 12 h.
Figure 2
Figure 2
Gene expression of well-characterized cell cycle genes. The expression profiles are shown for 20 well-characterized genes whose expression peaks in each phase of the cell cycle. Data are shown for each of the five time courses (114 total arrays). The purple bars above each column represent S phase and the arrows indicate mitoses as estimated by flow cytometry or BrdU labeling. In each time course, RNA was collected for points (typically every 1–2 h) for 30 h (Thy-Thy1), 44 h (Thy-Thy2), 46 h (Thy-Thy3), 36 h (Thy-Noc), or 14 h (Shake) after the synchronous arrest, at the intervals indicated. The four genes representing each cell cycle phase were averaged to create five different “ideal expression profiles” (G1/S, S, G2, G2/M, and M/G1).
Figure 3
Figure 3
Gene expression of the human cell cycle. (A) The 1134 periodically expressed clones are ordered by the point in the cell cycle where they show peak expression, as calculated from the sine and cosine coefficients of the Fourier transform. Each gene was assigned a cell cycle phase based on its correlation to an idealized expression profile defined in Figure 2. Color bars on the right represent the phase in which the majority of the genes are expressed (G1/S, green; S phase, blue; G2, red; G2/M, orange; and M/G1, black); this color scheme is used throughout the remainder of the figures. (B) The 1134 clones that have similar expression profiles are grouped together by hierarchical clustering. The biological theme of each cluster is shown on the right, and the color of the bar indicates the cell cycle phase represented by the genes. The cell adhesion and chromosome metabolism clusters have been labeled a, b, and c as each cluster contains similar GO annotations. Both figures, with all gene names and accession numbers, are available as Supplemental Figure 9 at the Mol. Biol. Cell Web site and at a Web site maintained by the authors (http://genome-www.stanford.edu/Human-CellCycle/HeLa/).
Figure 3
Figure 3
Gene expression of the human cell cycle. (A) The 1134 periodically expressed clones are ordered by the point in the cell cycle where they show peak expression, as calculated from the sine and cosine coefficients of the Fourier transform. Each gene was assigned a cell cycle phase based on its correlation to an idealized expression profile defined in Figure 2. Color bars on the right represent the phase in which the majority of the genes are expressed (G1/S, green; S phase, blue; G2, red; G2/M, orange; and M/G1, black); this color scheme is used throughout the remainder of the figures. (B) The 1134 clones that have similar expression profiles are grouped together by hierarchical clustering. The biological theme of each cluster is shown on the right, and the color of the bar indicates the cell cycle phase represented by the genes. The cell adhesion and chromosome metabolism clusters have been labeled a, b, and c as each cluster contains similar GO annotations. Both figures, with all gene names and accession numbers, are available as Supplemental Figure 9 at the Mol. Biol. Cell Web site and at a Web site maintained by the authors (http://genome-www.stanford.edu/Human-CellCycle/HeLa/).
Figure 4
Figure 4
Genes associated with the proliferative state of tumors are cell cycle regulated. (A) Cell cycle regulation of the breast tumor proliferation cluster. The expression patterns of the 112 clones in the breast tumor proliferation cluster (Perou et al., 2000) were examined in the cell cycle dataset, along with their expression in breast tumors and cell lines. The clones are ordered by their peak expression during the cell cycle (as in Figure 3A) such that each row corresponds to a single clone. The order of the breast tumor samples based on hierarchical clustering by using 1753 genes is as described previously (Perou et al., 2000). The mitotic grade of the tumors is indicated (a higher mitotic grade is indicative of a more proliferative tumor). Of the 112 genes in the proliferation cluster, 69 were identified as cell cycle regulated in this study. (B) Cell cycle regulation of lymphoma proliferation cluster. Because the lymphoma study was performed on the Lymphochip Microarray, which is comprised of a different clone set than the Stanford Human Microarray used for this study, the genes on the two arrays were linked via their LocusLink ID (Pruitt and Maglott, 2001). We selected 154 clones from the previously published lymphoma proliferation cluster (Alizadeh et al., 2000), and 19 clones without LocusLink IDs were discarded. Of the remaining 135, 128 clones with matching LocusLink IDs were measured in our cell cycle study. Duplicate clones were removed leaving 96 genes. Of these, 43 were identified as cell cycle regulated in this study. As above, the genes (i.e., rows) are ordered by peak expression during the cell cycle. The order of the tumors, based on hierarchical clustering by using a larger data set, is as published previously (Alizadeh et al., 2000). This figure with all gene names is available as Supplemental Figure 10.
Figure 5
Figure 5
Expression of cell cycle-regulated genes in breast tumors. The tumor samples have been ordered by hierarchical clustering using 1753 genes as described previously (Perou et al., 2000). (A) Expression profiles are shown of 386 of the 1134 cell cycle-regulated clones that were also present in the breast cancer study (Perou et al., 2000). The clones are ordered by their similarity of gene expression profiles across both data sets by hierarchical clustering. (B) Detailed views of the clusters identified in Figure 5A. A subset of genes is expressed at lower levels in the more proliferative tumors (NODE379X, cluster i; NODE303X, cluster iv) and includes genes that peak at M/G1, S, and G2 phases. Genes for core cell cycle processes that peak at G2 and M phases (NODE142X, ii) or at G1 and S phases (NODE133X, iii) are highly expressed in the more proliferative tumors; many of these genes are the same genes found in the breast tumor proliferation cluster. A subset of cell cycle regulated genes is expressed in a heterogeneous manner (NODE345X, v). An enhanced figure with all gene names is available as Supplemental Figure 11.
Figure 5
Figure 5
Expression of cell cycle-regulated genes in breast tumors. The tumor samples have been ordered by hierarchical clustering using 1753 genes as described previously (Perou et al., 2000). (A) Expression profiles are shown of 386 of the 1134 cell cycle-regulated clones that were also present in the breast cancer study (Perou et al., 2000). The clones are ordered by their similarity of gene expression profiles across both data sets by hierarchical clustering. (B) Detailed views of the clusters identified in Figure 5A. A subset of genes is expressed at lower levels in the more proliferative tumors (NODE379X, cluster i; NODE303X, cluster iv) and includes genes that peak at M/G1, S, and G2 phases. Genes for core cell cycle processes that peak at G2 and M phases (NODE142X, ii) or at G1 and S phases (NODE133X, iii) are highly expressed in the more proliferative tumors; many of these genes are the same genes found in the breast tumor proliferation cluster. A subset of cell cycle regulated genes is expressed in a heterogeneous manner (NODE345X, v). An enhanced figure with all gene names is available as Supplemental Figure 11.
Figure 6
Figure 6
G1 and S phase clusters. Shown are detailed views of the cell cycle clusters indicated in Figure 3B. Only a portion of each cluster is shown; the full cluster with all gene names, phase assignments, and annotations can be viewed in Supplemental Figure 12. The names of selected genes and their corresponding rows (indicated by an arrow) are shown to the right. Some genes had multiple clones on the arrays that clustered together (e.g., CDC25A and Golgin-67) and are indicated by a bracket. The GO biological process annotation is shown for each gene. Due to the incomplete application of GO to the human genome, we have assigned the biological process to some genes provisionally; an asterisk (*) precedes these terms. (A) Early DNA replication cluster (NODE1077X) contains 202 clones (94 ESTs and hypothetical proteins); 88% have been assigned a phase of G1/S. (B) Late DNA replication cluster (NODE793X) contains 139 clones (66 ESTs and hypothetical proteins); 80% show peak expression in S phase. (C) Histone gene cluster (NODE 516X) contains 13 clones expressed during S phase; 12 of the clones are histone genes.
Figure 7
Figure 7
G2 and M phase clusters. Clusters of genes from Figure 3B involved in mitotic processes are shown in more detail. The annotation is as described in Figure 6. (A) Tubulin gene cluster (NODE481X) contains 18 clones (six ESTs) that peak at G2 of the cell cycle. The coordinate expression of the α- and β-tubulins is notable. (B) Spindle assembly cluster (NODE180X) contains 49 clones (22 ESTs); 88% have been assigned a phase of G2, and many of the known genes are involved in establishment and maintenance of the mitotic spindle. (C) Mitotic surveillance cluster (NODE191X) contains 50 clones (13 ESTs) that primarily peak in G2/M. The full clusters with all gene names, phase assignments, and annotations can be viewed in Supplemental Figure 13.
Figure 8
Figure 8
M/G1 clusters. Three clusters of M/G1 genes from Figure 3B are shown in more detail. Each contains genes involved in cell adhesion, chromosome metabolism and RAS signal transduction and is annotated as described in Figure 6. Cluster A, (NODE568X) contains 104 clones (33 ESTs and hypothetical proteins); 37% show peak expression in G2/M and 63% show peak expression in M/G1. Cluster B, (NODE688X) is comprised of 12 clones (three ESTs), including CDK7, the cdk of the cdk-activating complex (CAK); 92% show peak expression in M/G1. Cluster C, (NODE988X) which peaks in late M/G1, contains 25 clones (eight ESTs and hypothetical proteins); 96% peak in M/G1. The full clusters with all gene names, phase assignments and annotations can be viewed in Supplemental Figure 14.

Comment in

  • It's the data!
    Botstein D. Botstein D. Mol Biol Cell. 2010 Jan 1;21(1):4-6. doi: 10.1091/mbc.e09-07-0575. Mol Biol Cell. 2010. PMID: 20048255 Free PMC article.

Similar articles

Cited by

References

    1. Abrieu A, Kahana JA, Wood KW, Cleveland DW. CENP-E as an essential component of the mitotic checkpoint in vitro. Cell. 2000;102:817–826. - PubMed
    1. Abrieu A, Magnaghi-Jaulin L, Kahana JA, Peter M, Castro A, Vigneron S, Lorca T, Cleveland DW, Labbe J. Mps1 is a kinetochore-associated kinase essential for the vertebrate mitotic checkpoint. Cell. 2001;106:83–93. - PubMed
    1. Adolph KW, Phelps JP. Role of non-histones in chromosome structure. Cell cycle variations in protein synthesis. J Biol Chem. 1982;257:9086–9092. - PubMed
    1. Alizadeh AA, et al. Distinct types of diffuse large B-cell lymphoma identified by gene expression profiling. Nature. 2000;403:503–511. - PubMed
    1. Alter O, Brown PO, Botstein D. Singular value decomposition for genome-wide expression data processing and modeling. Proc Natl Acad Sci USA. 2000;97:10101–10106. - PMC - PubMed

Publication types