. 2002 Jun 11;99(12):7998-8002.
doi: 10.1073/pnas.122238799.

Ultrafast spectroscopy reveals subnanosecond peptide conformational dynamics and validates molecular dynamics simulation

Affiliations

Ultrafast spectroscopy reveals subnanosecond peptide conformational dynamics and validates molecular dynamics simulation

Sebastian Spörlein et al. Proc Natl Acad Sci U S A. .

Abstract

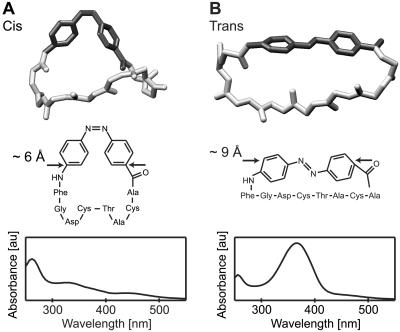
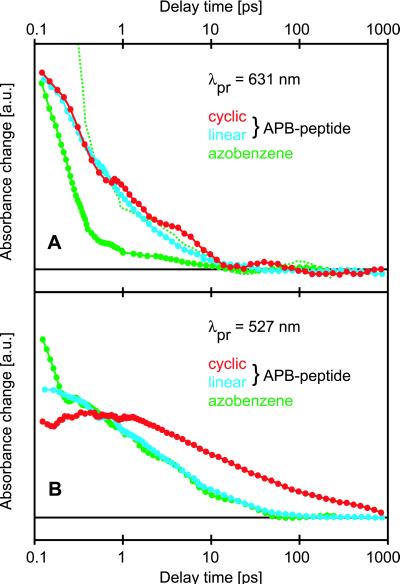
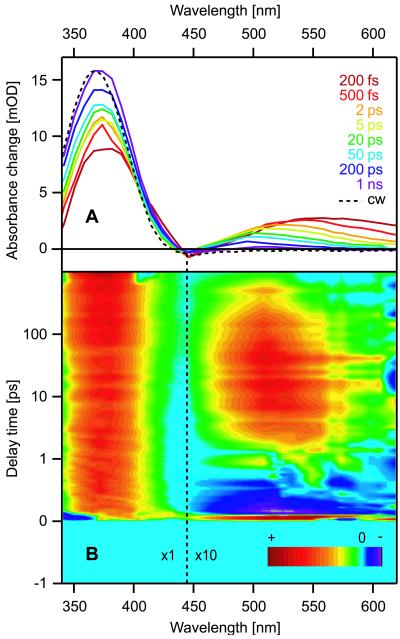
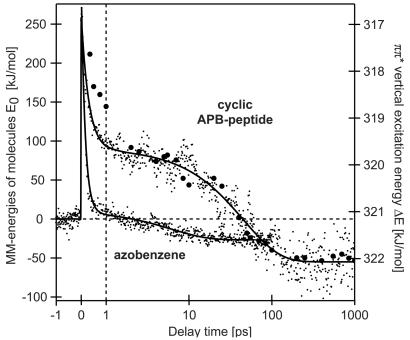
Femtosecond time-resolved spectroscopy on model peptides with built-in light switches combined with computer simulation of light-triggered motions offers an attractive integrated approach toward the understanding of peptide conformational dynamics. It was applied to monitor the light-induced relaxation dynamics occurring on subnanosecond time scales in a peptide that was backbone-cyclized with an azobenzene derivative as optical switch and spectroscopic probe. The femtosecond spectra permit the clear distinguishing and characterization of the subpicosecond photoisomerization of the chromophore, the subsequent dissipation of vibrational energy, and the subnanosecond conformational relaxation of the peptide. The photochemical cis/trans-isomerization of the chromophore and the resulting peptide relaxations have been simulated with molecular dynamics calculations. The calculated reaction kinetics, as monitored by the energy content of the peptide, were found to match the spectroscopic data. Thus we verify that all-atom molecular dynamics simulations can quantitatively describe the subnanosecond conformational dynamics of peptides, strengthening confidence in corresponding predictions for longer time scales.


Figures

Figure 1
Figure 1
(A) Structure of the cis-APB-peptide (Middle), corresponding absorption spectrum (Bottom), and snapshot from the MD simulations (Top), which represents the mean conformation of the molecule in the first picosecond. The peptide backbone (light gray) and the APB-group (dark gray) are shown. (B) Photoinduced cis/trans-isomerization leads to a considerable elongation of the APB moiety.
Figure 2
Figure 2
Comparison of transient absorbance changes on cis/trans-isomerization between linear (blue), cyclic (red) APB-peptides, and azobenzene (green) at probing wavelengths in a spectral region devoid of any ground state absorption (A) and in the low-frequency side of the nπ*-transition (B), respectively. In A, the curve for azobenzene is plotted on two different scales to depict its overall appearance and the matching behavior at delay times past 1 ps. A logarithmic scale is applied to the delay time.
Figure 3
Figure 3
(A) Transient spectra of cyclic APB-peptide showing the absorption change as a function of wavelength at certain delay times after the photoexcitation of the cis-isomer. The stationary difference spectrum (cistrans) corresponds to the dashed line. (B) Difference in transient absorption changes between cyclic and linear APB-peptide as a function of wavelength and delay time. The color table and the scaling factor for the amplitudes (×10 for λpr > 445 nm) are indicated in the plot. The scale is linear for delay times between −1 and 1 ps and logarithmic for longer delay times.
Figure 4
Figure 4
Comparison of the total energies (small dots) of the cis-APB-peptide and of azobenzene during six 1-ns MD simulations on light-induced cis/trans-isomerization (see Materials and Methods). The elapsed time is shown on the x axis on a linear/logarithmic scale, with the origin depicting the electronic excitation. Fits to the temporal evolution of the energies with biexponential decays are represented by solid lines. They are compared with experimental data (large dots) in the form of vertical excitation energies ΔE of the trans ππ*-transition, derived from Gaussian fits to peaks of the ππ*-absorption near 370 nm in the transient spectra depicted in Fig. 3A.

References

    1. Frauenfelder H, Sligar S G, Wolynes P G. Science. 1991;254:1598–1603. - PubMed
    1. Grubmüller H, Tavan P. J Chem Phys. 1994;101:5047–5057.
    1. Dill K A, Chan H S. Nat Struct Biol. 1997;4:10–19. - PubMed
    1. Guo Z Y, Brooks C L, Boczko E M. Proc Natl Acad Sci USA. 1997;94:10161–10166. - PMC - PubMed
    1. Duan Y, Kollman P A. Science. 1998;282:740–744. - PubMed

Publication types

LinkOut - more resources