. 2002 Jun-Jul;23(6):1038-48.

Posterior reversible encephalopathy syndrome: prognostic utility of quantitative diffusion-weighted MR images

Affiliations

Posterior reversible encephalopathy syndrome: prognostic utility of quantitative diffusion-weighted MR images

Diego J Covarrubias et al. AJNR Am J Neuroradiol. 2002 Jun-Jul.

Abstract

Background and purpose: The recently described posterior reversible encephalopathy syndrome (PRES) classically consists of reversible vasogenic edema in the posterior circulation territories, although conversion to irreversible cytotoxic edema has been described. We hypothesized that the extent of edema has prognostic implications and that diffusion-weighted MR imaging (DWI) can help predict the progression to infarction.

Methods: Twenty-two patients with PRES and 18 control subjects were examined with isotropic DWI. Nineteen regions of interest (ROIs) were systematically placed, and apparent diffusion coefficients (ADCs) were computed and correlated with T2 and DWI signal intensity in each ROI.

Results: T2 signal abnormalities were always present in territories of the posterior circulation. Anterior circulation structures were involved in 91% of patients. ADC values in areas of abnormal T2 signal were high. More extensive T2 signal abnormalities were seen in patients with a poor outcome than in patients who recovered. In six patients (27%), areas of high DWI signal intensity were seen with ADC values that were paradoxically normal, which we called pseudonormalized. Abnormal T2 signal intensity and high ADC values surrounded these areas. Follow-up images in two patients showed progression to infarction in pseudonormalized regions.

Conclusion: Vasogenic edema in PRES involves predominantly the posterior circulation territories, but anterior circulation structures are also frequently involved. The extent of combined T2 and DWI signal abnormalities correlate with patient outcome. High DWI signal intensity and pseudonormalized ADC values are associated with cerebral infarction and may represent the earliest sign of nonreversibility as severe vasogenic edema progresses to cytotoxic edema.


Figures
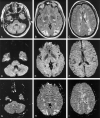
F<sc>ig</sc> 1.
Fig 1.
PRES in a pregnant woman with eclampsia (patient 21). A–C, Axial fluid-attenuated inversion recovery (FLAIR) MR images (TR/TE/TI/NEX, 11,002/140/2250/1; FOV, 20) show symmetric abnormal signal intensity, primarily in the territories of the posterior circulation. The affected area predominantly involves the white matter, but cortex is also involved. Note the involvement of the caudates, which was unusual in our series. D–F, Isotropic diffusion-weighted MR images (TR/TE, 10,000/91.7; FOV, 40; b = 1,000 s/mm2) show low to normal signal intensity in the areas of the FLAIR abnormality. G–I, ADC maps show increased values in the areas of FLAIR abnormality.
F<sc>ig</sc> 2.
Fig 2.
ROI placement. Axial FLAIR-prepped echo-planar T2-weighed images (TR/TE/TI, 10,000/91.7/2200; FOV, 40; b = 0 s/mm2) in a patient with PRES secondary to uremic encephalopathy (patient 17). Nineteen ROIs were systemically placed in 22 patients with PRES and 18 control subjects, as shown. The images were coregistered to the ADC map, on which measurements were taken. Typical ROI sizes varied with brain region, as follows: cerebellum, 400 mm2; pons, 240 mm2; lenticular nucleus, 250 mm2; corticospinal tract, 60 mm2; posterior temporal lobe, 360 mm2; caudate head, 60 mm2; thalamus, 220 mm2; occipital lobe, 360 mm2; parietal lobe, 400 mm2; frontal lobe, 500 mm2.
F<sc>ig</sc> 3.
Fig 3.
Mean ADC values in brain regions in patients with PRES and control subjects. Percentage of patients with T2 and FLAIR signal intensity abnormalities in each brain region is shown. Both posterior and anterior circulation structures are involved. ADC values in abnormal areas in patients are elevated compared with those in control subjects (P < .04); this finding was consistent with vasogenic edema. ADC values in control subjects were lower in the cerebellum and pons (P < .001). Mean ADC values from homologous hemispheric structures are averaged together for presentation purposes.
F<sc>ig</sc> 4.
Fig 4.
Atypical cases of PRES. A, Axial FLAIR MR image in a case of uremic encephalopathy (patient 18) shows marked frontal lobe involvement. B and C, Axial FLAIR MR images (TR/TE/TI/NEX, 11,002/140/2,250/1; FOV, 20) in a case of hemolytic-uremic syndrome (patient 22) show involvement in the temporal lobes and thalami. Note also the striking involvement of the brain stem.
F<sc>ig</sc> 5.
Fig 5.
In patients who had an adverse outcome (stroke or death), T2/DWI scores (P < .001) and ADC values (P < .02) were consistently higher than those of patients who recovered. Patient 4 had cortical DWI hyperintensity at presentation. The patient then recovered and was subsequently lost to follow-up. Patients 6 and 11 had cortical DWI hyperintensity with progression to stroke at follow-up. Patients 14, 15, and 18 had cortical DWI hyperintensity and died before follow-up. Patient 7 had foci of intracranial hemorrhage at presentation. Patients 12 and 22 had severe brain stem PRES.
F<sc>ig</sc> 6.
Fig 6.
Intravoxel averaging of cytotoxic and vasogenic edema in a case of cyclosporin neurotoxicity (patient 11). A and B, Axial FLAIR (TR/TE/TI/NEX, 11,002/140/2250/1; FOV, 20) (A) and echo-planar T2-weighted (TR/TE, 10,000/91.7; FOV, 40; b = 0 s/mm2) (B) MR images show bilateral areas of increased signal intensity in the occipitotemporal lobes, which are consistent with vasogenic edema (asterisk). A rim of abnormal signal intensity surrounds a small section of cortex, which is relatively spared with only mildly elevated signal intensity (arrow). C, Isotropic diffusion-weighted images (TR/TE, 10,000/91.7; FOV, 40; b = 1000 s/mm2) show high signal intensity in the areas of apparent sparing (arrowhead). D, ADC map shows increased diffusion in the areas of vasogenic edema (asterisk), as expected. The areas of high signal intensity in C do not have low ADC values, as would be expected in ischemic brain. Instead, the values are pseudonormalized (arrow). E, Follow-up FLAIR image obtained 28 days later shows increased signal intensity (arrowhead) corresponding to the region of abnormal findings at DWI. Gyriform, increased T1 signal intensity and subtle enhancement (not shown) was also present; this finding is consistent with petechial hemorrhage into a subacute infarct (not shown).
F<sc>ig</sc> 7.
Fig 7.
ADC values in areas of pseudonormalization. High values were seen in the subcortical white matter and pseudonormalized values were seen in the cortex. Pseudonormalization results from intravoxel averaging of vasogenic and cytotoxic edema in cortex. In two patients, follow-up images confirmed the development of infarcts in areas of pseudonormalization.
F<sc>ig</sc> 8.
Fig 8.
Schematic representations of the diffusion signal intensity in vasogenic edema and pseudonormalization in cortex affected by PRES. By definition, the slope of the signal intensity is plotted on the ADC map, and the magnitude of the signal intensity at b = 1,000 s/mm2 is plotted on the diffusion-weighted image. A, Vasogenic edema. Because water is highly mobile in areas of vasogenic edema, the slope of the signal intensity is steeper and the ADC values are higher, as shown in Figure 1G–I. At b = 1000 s/mm2, the magnitude of the diffusion signal intensity is either normal or below normal, as shown in Figure 1D–F. B, Pseudonormalization. The net diffusion signal intensity results from averaging of a cytotoxic component, which has restricted water motion and therefore has a shallow slope, and a vasogenic component, with a steep slope. The net diffusion signal intensity line is parallel to the normal case but higher in magnitude. Because the slopes are parallel, ADC values are isointense or normal in the areas of pseudonormalization, as shown in Figure 6D. Because the magnitude is higher at b = 1000 s/mm2, the DWI signal intensity is high, as shown in Figure 6C.

References

    1. Casey SO, Sampaio RC, Michel E, Truwit CL. Posterior reversible encephalopathy syndrome: utility of FLAIR imaging in the detection of cortical and subcortical lesions. AJNR Am J Neuroradiol 2000;21:1199–1206 - PMC - PubMed
    1. Schwartz RB, Mulkern RV, Gudbjartsson H, Jolesz F. Diffusion-weighted MR imaging in hypertensive encephalopathy: clues to pathogenesis. AJNR Am J Neuroradiol 1998;19:859–862 - PMC - PubMed
    1. Dillon W, Rowley H. The reversible posterior cerebral edema syndrome. AJNR Am J Neuroradiol 1998;19:591. - PMC - PubMed
    1. Hinchey J, Chaves C, Appignani B, et al. A reversible posterior leukoencephalopathy syndrome. N Engl J Med 1996;334:494–500 - PubMed
    1. Ay H, Buonanno FS, Schaefer PW et al. Posterior leukoencephalopathy without severe hypertension: utility of diffusion-weighted MRI. Neurology 1998;51:1369–1376 - PubMed

MeSH terms