. 2002 Jun 15;541(Pt 3):825-33.
doi: 10.1113/jphysiol.2002.016600.

Photolysis of caged cyclic AMP in the ciliary cytoplasm of the newt olfactory receptor cell

Affiliations

Photolysis of caged cyclic AMP in the ciliary cytoplasm of the newt olfactory receptor cell

Hiroko Takeuchi et al. J Physiol. .

Abstract

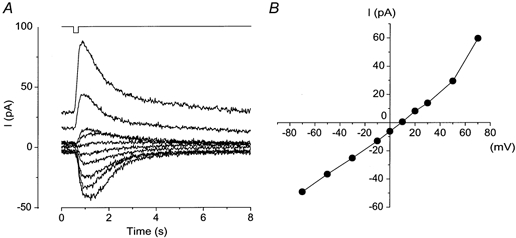
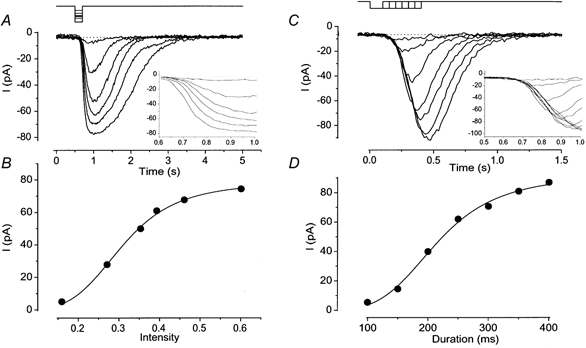
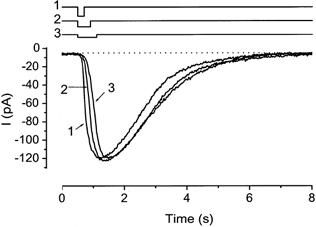
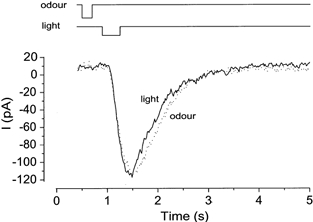
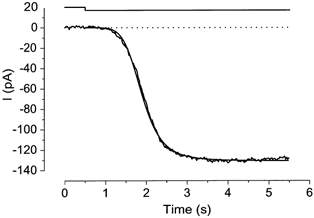
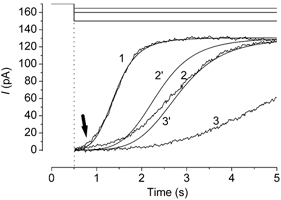
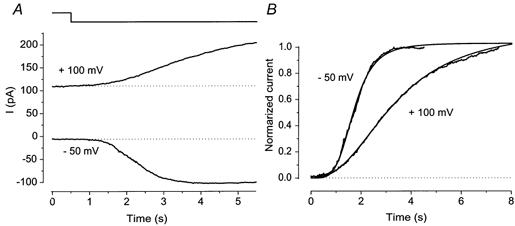
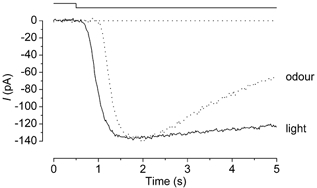
The effects of cyclic nucleotide monophosphate (cNMP) in the ciliary cytoplasm of the olfactory receptor cell were examined by using photolysis of caged cNMP loaded from the whole-cell patch clamp pipette. Illumination of the cilia induced an inward current at -50 mV. The current amplitude was voltage dependent and the polarity was reversed at +10 mV. The amplitude of the light-induced current was dependent on both light intensity and duration. The intensity-response relation was fitted well by the Hill equation with a coefficient (n(H)) of 4.99 +/- 2.66 (mean +/- S.D., n = 19) and the duration-response relation with a coefficient of 4.03 +/- 1.43 (n = 17). The activation time course of adenylyl cyclase was estimated by comparing the light-induced response with the odorant-induced response. Adenylyl cyclase was activated approximately 260 ms later from the onset of the odorant-stimulation. The light-induced current developed very sharply. This could be explained by the sequential openings of cAMP-gated and Ca2+-activated Cl- channels. At +100 mV, where Ca2+ influx is expected to be very small, the current rising phase became less steep. When the cells were stimulated by long steps of either odour or light, the odorant-induced current showed stronger decay than the light-induced response. This observation suggests that the molecular system regulating desensitization is situated upstream of cAMP production.


Figures

Figure 1
Figure 1. Voltage dependence of the current response induced by flash photolysis of 1 mm caged cGMP
A, whole-cell current recorded from the olfactory receptor cell. Holding voltage (Vh) was changed from −70 to +70 mV. Downward deflection of the upper trace indicates the timing and duration of the light stimulation (intensity, 0.45; duration, 200 ms). B, current-voltage (I-V) relation of the light-induced response. Data from A.
Figure 2
Figure 2. Intensity and duration dependence of the light-induced response
A, membrane currents were recorded from a cell loaded with 1 mm caged cGMP. Light intensity was varied, while the duration was kept constant (200 ms). Downward deflections of the upper trace indicate the timing and duration of the light stimulation. Vh =−50 mV. Inset, expanded time course for the current rising phase. B, intensity-response relation of the light-induced current. Peak amplitudes of responses obtained in A were plotted against the intensity of light. The smooth line was drawn by a least square fitting of the data points by the Hill equation, I =Imax×SnH/(SnH+ K1/2nH), where I is the current, S is the intensity of light, K1/2 is the half-maximum intensity and nH is the Hill coefficient. Imax = 78.2 pA, K1/2 = 0.31 and nH = 4.58. C, light duration was changed, while the intensity was kept constant (0.27). Different cell from A. Vh =−50 mV. Inset, expanded time course for the current rising phase. D, duration-response relation of the light-induced current. Peak amplitudes of the responses obtained in C were plotted against the duration of light stimuli. The smooth line was drawn by a least square fitting of the data points by the Hill equation with Imax = 89.9 pA, K1/2 = 212.3 ms and nH = 4.34.
Figure 3
Figure 3. Responses induced by the same amount of light stimuli
Duration, 200, 400 and 600 ms. Intensity, 0.46, 0.23 and 0.15. Downward deflections of upper traces indicate the timing and duration of the light stimulation. Numbers indicate the sequences of the experiments. The cell was loaded with 1 mm caged cGMP. Vh =−50 mV. Note that the peak values are the same in the various conditions.
Figure 4
Figure 4. Determination of light condition causing a response identical to odorant response
First, odorant stimulation (1 mm citralva) was applied to induce approximately 90 % saturating response. Then, the intensity, timing and duration of light stimulation were adjusted to induce the same waveform of the response. The cell was loaded with 1 mm caged cGMP. Downward deflections of the upper trace indicate the timing and the duration of the light and odour stimuli. Light intensity, 0.08. Vh =−50 mV.
Figure 5
Figure 5. Rising phase of the current induced by the photolysis
Fitting of the rising phase by the Hill equation. Downward deflection of the upper trace indicates the light step. The cell was loaded with 1 mm caged cAMP. Light intensity, 0.12. Least square fitting was performed on current after the onset of light stimulation. The best fitting was obtained with Imax = 130.6 pA, K1/2 = 1.39 s and nH = 5.67. Vh =−50 mV.
Figure 8
Figure 8. Current reduction from the theoretical curves during a prolonged stimulation
Responses were induced by three different intensities of light steps. The upward deflections of current traces indicate the inward current. Numbers indicate the sequence of the experiments. The cell was loaded with 1 mm caged cAMP. Light intensity, 0.12, 0.07 and 0.06. Vh =−50 mV. Current reduction was observed during long light steps. The current response (1) was fitted by the Hill equation (nH = 5.73, K1/2 = 1.41 s). Two other lines were drawn according to an assumption that the production rate for cAMP increases in proportion to the light intensity (therefore, K1/2 = 2.35 s and 2.82 s. Time zero corresponds to the onset of illumination. An arrow indicates a deviation from the Hill fitting with high nH.
Figure 6
Figure 6. Voltage dependence of the rising phase
A, light-induced currents obtained at −50 mV and +100 mV. Downward deflection of the upper trace indicates light steps. Note that the rising phase at +100 mV is remarkably slower than that obtained at −50 mV. B, voltage dependence of cooperativity. Current records shown in A were fitted by the Hill equation with nH = 4.52 (-50 mV) and nH = 2.49 (+100 mV). Time zero corresponds to the onset of illumination. The rising phase illustrated in Fig. 1 seems to be constant throughout the varied holding voltages. Note, however, that the experiment in Fig. 1 was carried out using a very bright flash which causes a rapid increase of response, and it was done only up to +50 mV.
Figure 7
Figure 7. Differences between odour and light responses to prolonged stimuli
Continuous and dashed lines represent responses induced by light and odorant (1 mm citralva), respectively. Downward deflection of the upper trace indicates both the light and odour stimuli. Light intensity was 0.27. The cell was loaded with 1 mm caged cGMP.

Similar articles

Cited by

References

    1. Bakalyar HA, Reed RR. The second messenger cascade in olfactory receptor neurons. Current Opinion in Neurobiology. 1991;1:204–208. - PubMed
    1. Borisy FF, Ronette GV, Cunningham AM, Juilfs D, Beavo J, Snyder SH. Calcium/calmodulin-activated phosphodiesterase expressed in olfactory receptor neurons. Journal of Neuroscience. 1992;3:915–923. - PMC - PubMed
    1. Breer H, Boekhoff I. Second messenger signaling in olfaction. Current Opinion in Neurobiology. 1992;2:439–443. - PubMed
    1. Chen C, Nakamura T, Koutalos Y. Cyclic AMP diffusion coefficient in frog olfactory cilia. Biophysical Journal. 1999;76:2861–2867. - PMC - PubMed
    1. Chen T-Y, Yau K-W. Direct modulation by Ca2+-calmodulin of cyclic nucleotide-activated channel of rat olfactory receptor neurons. Nature. 1994;368:545–548. - PubMed

Publication types