. 2002 Jun 15;541(Pt 3):877-94.
doi: 10.1113/jphysiol.2001.016154.

Enhancement of calcium signalling dynamics and stability by delayed modulation of the plasma-membrane calcium-ATPase in human T cells

Affiliations

Enhancement of calcium signalling dynamics and stability by delayed modulation of the plasma-membrane calcium-ATPase in human T cells

Diana M Bautista et al. J Physiol. .

Abstract

In addition to its homeostatic role of maintaining low resting levels of intracellular calcium ([Ca2+](i)), the plasma-membrane calcium-ATPase (PMCA) may actively contribute to the generation of complex Ca2+ signals. We have investigated the role of the PMCA in shaping Ca2+ signals in Jurkat human leukaemic T cells using single-cell voltage-clamp and calcium-imaging techniques. Crosslinking the T-cell receptor with the monoclonal antibody OKT3 induces a biphasic elevation in [Ca2+](i) consisting of a rapid overshoot to a level > 1 microM, followed by a slow decay to a plateau of approximately 0.5 microM. A similar overshoot was triggered by a constant level of Ca2+ influx through calcium-release-activated Ca2+ (CRAC) channels in thapsigargin-treated cells, due to a delayed increase in the rate of Ca2+ clearance by the PMCA. Following a rise in [Ca2+](i), PMCA activity increased in two phases: a rapid increase followed by a further calcium-dependent increase of up to approximately fivefold over 10-60 s, termed modulation. After the return of [Ca2+](i) to baseline levels, the PMCA recovered slowly from modulation (tau approximately 4 min), effectively retaining a 'memory' of the previous [Ca2+](i) elevation. Using a Michaelis-Menten model with appropriate corrections for cytoplasmic Ca2+ buffering, we found that modulation extended the dynamic range of PMCA activity by increasing both the maximal pump rate and Ca2+ sensitivity (reduction of K(M)). A simple flux model shows how pump modulation and its reversal produce the initial overshoot of the biphasic [Ca2+](i) response. The modulation of PMCA activity enhanced the stability of Ca2+ signalling by adjusting the efflux rate to match influx through CRAC channels, even at high [Ca2+](i) levels that saturate the transport sites and would otherwise render the cell defenceless against additional Ca2+ influx. At the same time, the delay in modulation enables small Ca2+ fluxes to transiently elevate [Ca2+](i), thus enhancing Ca2+ signalling dynamics.


Figures
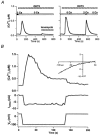
Figure 2
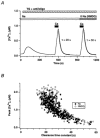
Figure 2. Ca2+ clearance shapes the biphasic response
A, calcium-induced Ca2+ release (CICR) was tested as a possible contributor to the biphasic Ca2+ response. Cells were treated with OKT3 as in Fig. 1B. Following Ca2+ release from stores, application of 4 μM ionomycin caused a minimal increase in [Ca2+]i, indicating that stores had indeed been emptied by OKT3 (left graph). Average of 271 cells. In the right-hand graph, extracellular Ca2+ (Ca2+o) was applied briefly to OKT3-treated cells to elevate [Ca2+]i to the plateau level seen in Fig. 1B. [Ca2+]i did not continue to increase after removal of Ca2+o, showing that the overshoot in Fig. 1B was not due to CICR. Average of 186 cells. B, constant Ca2+ influx evoked biphasic [Ca2+]i elevation in a voltage-clamped cell. Thapsigargin (TG; 1 μM) was applied to an indo-1-loaded Jurkat cell bathed in 2 mm Ca2+ Ringer solution to deplete Ca2+ stores and open CRAC channels. In this perforated-patch recording, shifting the holding potential from +30 mV to −100 mV induced Ca2+ influx through open CRAC channels, resulting in a rapid increase in [Ca2+]i to a peak level followed by a slow decay to a steady-state plateau. The inset shows a leak-subtracted ramp current measured 8 s after hyperpolarization, illustrating the inward rectification and positive reversal potential characteristics of CRAC.
Figure 1
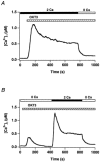
Figure 1. T cell receptor stimulation evokes a biphasic rise in [Ca2+]i
A, Jurkat cells were treated with OKT3 (1:100 ascites) in 2 mm Ca2+ Ringer solution to release Ca2+ from intracellular Ca2+ stores and activate Ca2+ influx through calcium-release-activated Ca2+ (CRAC) channels. A biphasic [Ca2+]i response was observed in the population average (n = 307 cells) as well as in individual cells (not shown). B, the biphasic response occurred even after Ca2+ release from stores was complete. Cells were treated with 1:100 OKT3 in Ca2+-free Ringer solution to completely empty the inositol 1,4,5-trisphosphate (IP3)-sensitive stores. Subsequent readdition of 2 mm Ca2+ evoked a biphasic [Ca2+]i rise due to influx through open CRAC channels. Average of 277 cells.
Figure 10
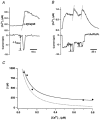
Figure 10. The Ca2+ dependence of cytosolic Ca2+ buffering in indo-1-loaded cells
Measurements from the same cell as used for Fig. 9. A, perturbations of ICRAC and d[Ca2+]i/dt at low [Ca2+]i. d[Ca2+]i/dt and ICRAC were increased by a brief hyperpolarization (+30 mV to −50 mV). ICRAC was measured after subtraction of the leak current collected in zero-calcium Ringer solution at the appropriate voltage (+30 or −50 mV) as described (see Methods). The initial slope of d[Ca2+]i/dt was determined as shown. B, perturbations of ICRAC and d[Ca2+]i/dt at high [Ca2+]i. The cell was hyperpolarized from +30 mV to −80 mV to drive [Ca2+]i to a high plateau. Then, brief steps from −80 to −120 mV were applied and changes in ICRAC and d[Ca2+]i/dt were measured. C, the effective cell volume, β, a measure of total buffering capacity (κ) scaled by cell volume, as a function of [Ca2+]i. β was calculated at each value of [Ca2+]i using eqn (5), and ΔICRAC and Δd[Ca2+]i/dt values were measured as described in A and B. The continuous curve is the best fit of eqns (6) and (7) (see text for parameter values). The dashed curve indicates the estimated contribution of intracellular indo-1 alone to cytosolic buffering and effective cell volume (calculated after setting κcyto to 0 in eqn (6)).
Figure 9
Figure 9. PMCA modulation changes the Ca2+ dependence of the clearance rate
Perforated-patch recording and [Ca2+]i measurements were made from an indo-1-loaded cell treated with 1 μM TG. A, measurement of the Ca2+ dependence of clearance by the unmodulated PMCA. [Ca2+]i transients of varying amplitudes were generated by hyperpolarization for 2-7 s from the holding potential of +30 mV to potentials of −50 to −120 mV (bars). Fits to the initial slope of the [Ca2+]i decay are superimposed and are plotted in C (□). B, Ca2+ clearance by the modulated PMCA. A steady-state level of modulation was produced by hyperpolarization to −120 mV for 80 s. Upon return to +30 mV, [Ca2+]i decayed back to baseline. The derivative of the [Ca2+]i decay is plotted against the corresponding [Ca2+]i in C (○). C, PMCA modulation enhanced clearance at all levels of [Ca2+]i. Michaelis-Menten relationships (see text) were fitted to the d[Ca2+]i/dt vs.[Ca2+]i data from A and B, yielding estimates of KM = 480 nm, Vmax = 29 nm s−1, nH = 2 (unmodulated) and KM = 430 nm, Vmax = 50 nm s−1, nH = 2 (modulated). Because the effects of cytosolic Ca2+ buffering are not included here, these fits provide only an empirical description of the Ca2+ dependence of the clearance rate, and do not describe PMCA activity itself (compare with Fig. 11).
Figure 3
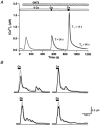
Figure 3. Complex Ca2+ clearance kinetics in Jurkat cells
A, recovery from 15- and 40-s periods of Ca2+ influx in OKT3-treated cells. Ca2+ (2 mm) was applied as indicated by the bars. The recovery of [Ca2+]i following a 15-s period of Ca2+ entry followed an exponential time course. Addition of Ca2+ for 40 s evoked larger transients that decayed to baseline with an approximately biexponential time course in single cells as well as in the population average from 122 cells shown here. B, oscillations during [Ca2+]i recovery in single cells. Recovery from the second Ca2+ application in A is shown for four cells, superimposed on the average response from A. Of the cell population, 12 % (15/122 cells) responded in this way.
Figure 4
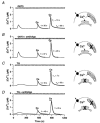
Figure 4. Contributions of plasma-membrane Ca2+-ATPase (PMCA), sarcoplasmic and endoplasmic reticulum Ca2+-ATPases (SERCA) and mitochondria to Ca2+ clearance
Cells were stimulated with OKT3 or TG in calcium-free Ringer solution with or without mitochondrial inhibitors, followed by brief applications of 2 mm Ca2+o. In each panel, the average [Ca2+]i of 122-255 cells is shown, and the cartoons at the right illustrate the major Ca2+ flux pathways that are functional during recovery in zero Ca2+o. A, clearance in OKT3-stimulated cells. Data reproduced from Fig. 3A. B, mitochondrial contribution to Ca2+ clearance in cells with functional SERCA. Inhibiting mitochondria with 2 μM antimycin A1 + 1 μM oligomycin (anti/oligo) elicited a monoexponential decay following both 15-s and 40-s applications of Ca2+. The decay time course following the 40-s period of capacitative Ca2+ entry (CCE) was intermediate between the fast and slow time constants seen in A. C, contribution of SERCA to Ca2+ clearance. Full inhibition of SERCA by 1 μM TG had no effect on clearance after a short period of Ca2+ entry. Following 40 s of CCE, the slow component of decay was accelerated by ≈30 %. D, effect of simultaneous inhibition of SERCA and mitochondria. With SERCA- and mitochondria-mediated Ca2+ uptake blocked, the acceleration of Ca2+ clearance during the second Ca2+ application must arise from enhanced efflux across the plasma membrane.
Figure 5
Figure 5. Na+-Ca2+ exchange does not contribute to Ca2+ clearance
Ca2+ extrusion was not affected by the replacement of extracellular Na+ with N-methyl-d-glucamine (NMDG). A, cells were stimulated as in Fig. 4D (TG + anti/oligo). CCE was induced for 60 s and clearance rates were measured in the presence and absence of Na+, as indicated. B, extrusion rates vs. peak [Ca2+]i in single cells from the experiment shown in A.
Figure 6
Figure 6. The role of the PMCA in Ca2+ clearance from Jurkat cells
A, effect of ATP depletion on Ca2+ clearance kinetics in single cells. Control cells were treated with 2 μM ionomycin to generate a large Ca2+ transient, followed by calcium-free Ringer solution. In ATP-depleted cells (see text) Ca2+ clearance was inhibited to varying extents, as demonstrated by these single-cell responses. B, effects of ATP depletion at the population level (288 cells). The cumulative histogram shows the fraction of cells with particular clearance time constant > τ; the right-most point includes cells with τ > 1000 s. The dotted line shows that clearance has been inhibited by >95 % in > half of the cells. C, La3+ (2 mm) inhibited Ca2+ clearance by > 90 % in a population of 257 cells. D, effect of carboxyeosin on Ca2+ clearance. Because carboxyeosin is fluorescent at fura-2 wavelengths, experiments were conducted on single indo-1-loaded cells following a 30-min preincubation with 20 μM carboxyeosin. Following treatment with carboxyeosin, the recovery from a CCE transient was reduced by a factor of approximately three (average of three cells).
Figure 7
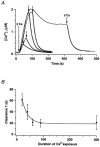
Figure 7. Calcium- and time-dependent modulation of PMCA activity
The experimental conditions described in Fig. 4D were also used here. A, Ca2+ influx was induced in TG-treated cells for varying periods of time (10-300 s) by changing the duration of exposure to 2 mm Ca2+ Ringer solution (dashed arrows). Single-exponential fits are superimposed on each recovery phase. B, PMCA activity increased with the duration of CCE. For each duration, the average τ (± s.e.m.) was obtained from ≈500 single-cell measurements in 3 experiments, as described in A.
Figure 8
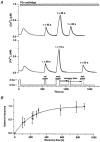
Figure 8. Reversal kinetics of PMCA modulation
A, a three-pulse protocol was used to measure the time course of recovery from PMCA modulation. Experimental conditions were identical to those in Fig. 4D. An initial brief Ca2+ application established the activity of the unmodulated PMCA (τref), and a subsequent longer application induced modulation, as shown by the decreased τ of clearance (τmod). A third brief test pulse was given at varying intervals after the modulating pulse, and the time constant of clearance (τtest) was used to monitor recovery from modulation. The upper trace shows that PMCA modulation persisted after 180 s, while the lower trace shows that reversal of modulation was complete after 500 s. B, kinetics of recovery from modulation. The extent of recovery was calculated as (τtest - τmod)/(τref - τmod), and each data point is an average of ≈1000 cells from a minimum of 3 experiments. A single exponential curve with a τ of 240 s is superimposed on the data.
Figure 11
Figure 11. Modulation increases the Ca2+ sensitivity and dynamic range of PMCA activity
PMCA velocity (VPMCA) as a function of [Ca2+]i is shown for the unmodulated (▪) and modulated (○) conditions for the cell used for Figs 9 and 10. VPMCA at each level of [Ca2+]i was determined by scaling the d[Ca2+]i/dt measurements (Fig. 9C) by β (Fig. 10C), as described in eqn (8). Fits of the Michaelis-Menten relationship are superimposed (parameter values given in the text).
Figure 12
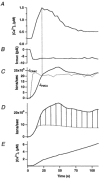
Figure 12. PMCA modulation enhances the dynamics and stability of signals produced by store-operated CRAC channels
Data in A and B are reproduced from Fig. 2B, and predicted curves in C-E were calculated as described in the text. A and B, an overshooting Ca2+ response was evoked by a step increase in ICRAC. C, delayed PMCA modulation enhances the dynamics of [Ca2+]i signals. The calculated PMCA flux rises more slowly than the CRAC flux, until the two are equal at the peak of the [Ca2+]i response. Further increase in JPMCA causes [Ca2+]i to decline until JPMCA and JCRAC are equal and a plateau is attained. D, a comparison of JPMCA with the estimated flux in the absence of modulation (dotted line). The unmodulated PMCA flux was derived from eqn (1), with KM = 0.38 μM, nH = 1.8 and Vmax = 107 ions s−1. The comparison shows that modulation is responsible for the overshoot and boosts PMCA activity to match influx through CRAC channels and stabilize [Ca2+]i. E, PMCA modulation enhances the stability of [Ca2+]i signals. In the absence of PMCA modulation, constant ICRAC is predicted to cause [Ca2+]i to rise indefinitely because influx through CRAC channels exceeds the efflux afforded by the unmodulated pump (D).

Similar articles

Cited by

References

    1. Almers W, Neher E. The Ca signal from fura-2 loaded mast cells depends strongly on the method of dye-loading. FEBS Letters. 1985;192:13–18. - PubMed
    1. Arnaudeau S, Kelley WL, Walsh JV, Jr, Demaurex N. Mitochondria recycle Ca2+ to the endoplasmic reticulum and prevent the depletion of neighboring endoplasmic reticulum regions. Journal of Biological Chemistry. 2001;276:29430–29439. - PubMed
    1. Babcock DF, Hille B. Mitochondrial oversight of cellular Ca2+ signaling. Current Opinion in Neurobiology. 1998;8:398–404. - PubMed
    1. Balasubramanyam M, Gardner JP. Protein kinase C modulates cytosolic free calcium by stimulating calcium pump activity in Jurkat T cells. Cell Calcium. 1995;18:526–541. - PubMed
    1. Balasubramanyam M, Kimura M, Aviv A, Gardner JP. Kinetics of calcium transport across the lymphocyte plasma membrane. American Journal of Physiology. 1993;265:C321–327. - PubMed

Publication types

MeSH terms

LinkOut - more resources