

Signals involved in Arabidopsis resistance to Trichoplusia ni caterpillars induced by virulent and avirulent strains of the phytopathogen Pseudomonas syringae
- PMID: 12068100
- PMCID: PMC161673
- DOI: 10.1104/pp.010815
Signals involved in Arabidopsis resistance to Trichoplusia ni caterpillars induced by virulent and avirulent strains of the phytopathogen Pseudomonas syringae
Abstract
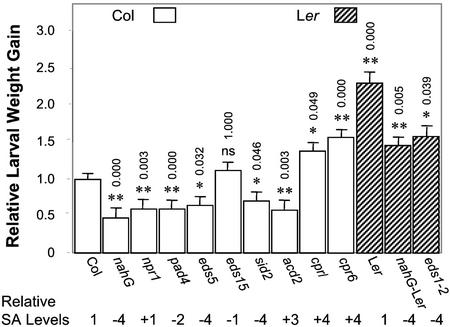
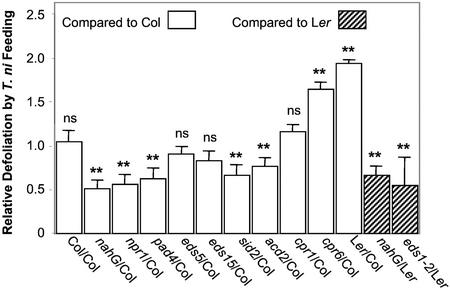
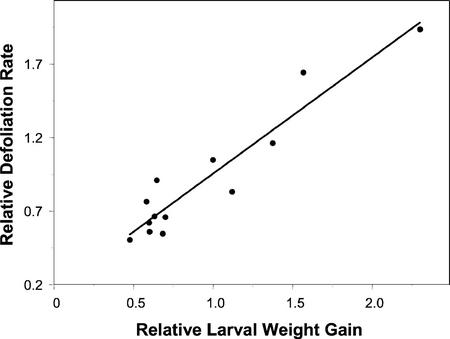
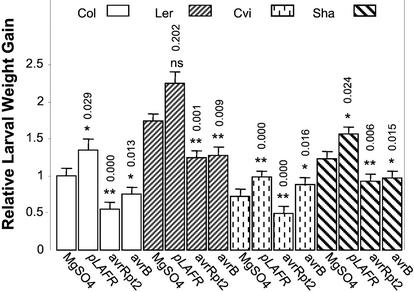
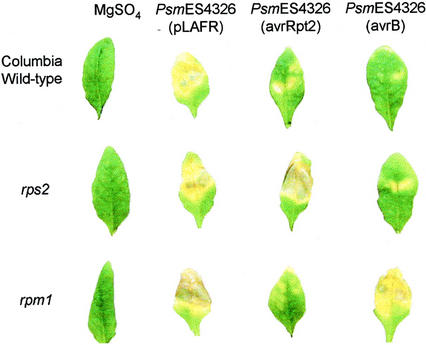
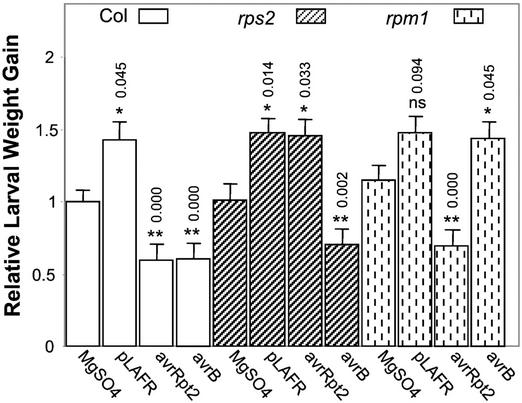
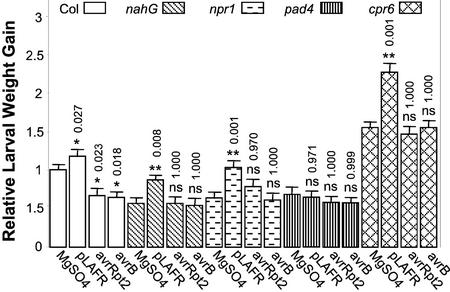
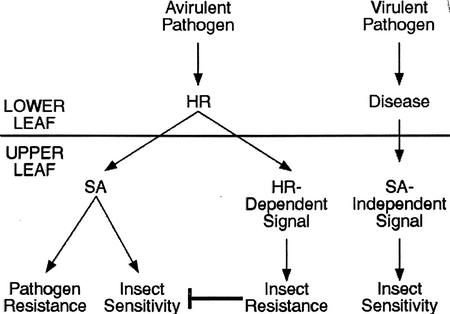
Plants have evolved different but interconnected strategies to defend themselves against herbivorous insects and microbial pathogens. We used an Arabidopsis/Pseudomonas syringae pathosystem to investigate the impact of pathogen-induced defense responses on cabbage looper (Trichoplusia ni) larval feeding. Arabidopsis mutants [npr1, pad4, eds5, and sid2(eds16)] or transgenic plants (nahG) that are more susceptible to microbial pathogens and are compromised in salicylic acid (SA)-dependent defense responses exhibited reduced levels of feeding by T. ni compared with wild-type plants. Consistent with these results, Arabidopsis mutants that are more resistant to microbial pathogens and have elevated levels of SA (cpr1 and cpr6) exhibited enhanced levels of T. ni feeding. These experiments suggested an inverse relationship between an active SA defense pathway and insect feeding. In contrast to these results, there was increased resistance to T. ni in wild-type Arabidopsis ecotype Columbia plants that were infected with P. syringae pv. maculicola strain ES4326 (Psm ES4326) expressing the avirulence genes avrRpt2 or avrB, which elicit a hypersensitive response, high levels of SA accumulation, and systemic acquired resistance to bacterial infection. Similar results were obtained with other ecotypes, including Landsberg erecta, Cape Verdi Islands, and Shakdara. When infected with Psm ES4326(avrRpt2) or Psm ES4326(avrB), nahG transgenic and npr1 mutant plants (which are more susceptible to virulent and avirulent P. syringae strains) failed to show the increased insect resistance exhibited by wild-type plants. It was surprising that wild-type plants, as well as nahG and npr1 plants, infected with Psm ES4326 not expressing avrRpt2 or avrB, which elicits disease, became more susceptible to T. ni. Our results suggest two potentially novel systemic signaling pathways: a systemic response elicited by HR that leads to enhanced T. ni resistance and overrides the SA-mediated increase in T. ni susceptibility, and a SA-independent systemic response induced by virulent pathogens that leads to enhanced susceptibility to T. ni.
Figures
Similar articles
-
Proteomics and functional analyses of Arabidopsis nitrilases involved in the defense response to microbial pathogens.Planta. 2016 Aug;244(2):449-65. doi: 10.1007/s00425-016-2525-3. Epub 2016 Apr 19. Planta. 2016. PMID: 27095107
-
The Pseudomonas syringae type III effector AvrRpt2 functions downstream or independently of SA to promote virulence on Arabidopsis thaliana.Plant J. 2004 Feb;37(4):494-504. doi: 10.1111/j.1365-313x.2003.01984.x. Plant J. 2004. PMID: 14756766
-
The Arabidopsis flavin-dependent monooxygenase FMO1 is an essential component of biologically induced systemic acquired resistance.Plant Physiol. 2006 Aug;141(4):1666-75. doi: 10.1104/pp.106.081257. Epub 2006 Jun 15. Plant Physiol. 2006. PMID: 16778014 Free PMC article.
-
Use of Arabidopsis thaliana defense-related mutants to dissect the plant response to pathogens.Proc Natl Acad Sci U S A. 1995 May 9;92(10):4189-96. doi: 10.1073/pnas.92.10.4189. Proc Natl Acad Sci U S A. 1995. PMID: 7753782 Free PMC article. Review.
-
Plant defense: one post, multiple guards?!Mol Cell. 2003 Feb;11(2):284-6. doi: 10.1016/s1097-2765(03)00072-8. Mol Cell. 2003. PMID: 12620215 Review.
Cited by
-
Comparative genomics of multiple strains of Pseudomonas cannabina pv. alisalensis, a potential model pathogen of both monocots and dicots.PLoS One. 2013;8(3):e59366. doi: 10.1371/journal.pone.0059366. Epub 2013 Mar 28. PLoS One. 2013. PMID: 23555661 Free PMC article.
-
Phenotypic diversity and altered environmental plasticity in Arabidopsis thaliana with reduced Hsp90 levels.PLoS One. 2007 Jul 25;2(7):e648. doi: 10.1371/journal.pone.0000648. PLoS One. 2007. PMID: 17653275 Free PMC article.
-
Major signaling pathways modulate Arabidopsis glucosinolate accumulation and response to both phloem-feeding and chewing insects.Plant Physiol. 2005 Jun;138(2):1149-62. doi: 10.1104/pp.104.053389. Epub 2005 May 27. Plant Physiol. 2005. PMID: 15923339 Free PMC article.
-
Pathogen-triggered ethylene signaling mediates systemic-induced susceptibility to herbivory in Arabidopsis.Plant Cell. 2013 Nov;25(11):4755-66. doi: 10.1105/tpc.113.113415. Epub 2013 Nov 27. Plant Cell. 2013. PMID: 24285796 Free PMC article.
-
The sugarcane defense protein SUGARWIN2 causes cell death in Colletotrichum falcatum but not in non-pathogenic fungi.PLoS One. 2014 Mar 7;9(3):e91159. doi: 10.1371/journal.pone.0091159. eCollection 2014. PLoS One. 2014. PMID: 24608349 Free PMC article.
References
-
- Alonso JM, Hirayama T, Roman G, Nourizadeh S, Ecker JR. EIN2, a bifunctional transducer of ethylene and stress responses in Arabidopsis. Science. 1999;284:2148–2152. - PubMed
-
- Axtell MJ, McNellis TW, Mudgett MB, Hsu CS, Staskawicz BJ. Mutational analysis of the Arabidopsis RPS2 disease resistance gene and the corresponding Pseudomonas syringae avrRpt2 avirulence gene. Mol Plant-Microbe Interact. 2001;14:181–188. - PubMed
-
- Bergelson J, Kreitman M, Stahl EA, Tian D. Evolutionary dynamics of plant R-genes. Science. 2001;292:2281–2285. - PubMed
Publication types
MeSH terms
Substances
Grants and funding
LinkOut - more resources
Full Text Sources
Other Literature Sources
Molecular Biology Databases
Miscellaneous
