. 2002 Jun;129(2):797-807.
doi: 10.1104/pp.010931.

Functional analysis of the cellulose synthase genes CesA1, CesA2, and CesA3 in Arabidopsis

Affiliations

Functional analysis of the cellulose synthase genes CesA1, CesA2, and CesA3 in Arabidopsis

Joanne E Burn et al. Plant Physiol. 2002 Jun.

Abstract

Polysaccharide analyses of mutants link several of the glycosyltransferases encoded by the 10 CesA genes of Arabidopsis to cellulose synthesis. Features of those mutant phenotypes point to particular genes depositing cellulose predominantly in either primary or secondary walls. We used transformation with antisense constructs to investigate the functions of CesA2 (AthA) and CesA3 (AthB), genes for which reduced synthesis mutants are not yet available. Plants expressing antisense CesA1 (RSW1) provided a comparison with a gene whose mutant phenotype (Rsw1(-)) points mainly to a primary wall role. The antisense phenotypes of CesA1 and CesA3 were closely similar and correlated with reduced expression of the target gene. Reductions in cell length rather than cell number underlay the shorter bolts and stamen filaments. Surprisingly, seedling roots were unaffected in both CesA1 and CesA3 antisense plants. In keeping with the mild phenotype compared with Rsw1(-), reductions in total cellulose levels in antisense CesA1 and CesA3 plants were at the borderline of significance. We conclude that CesA3, like CesA1, is required for deposition of primary wall cellulose. To test whether there were important functional differences between the two, we overexpressed CesA3 in rsw1 but were unable to complement that mutant's defect in CesA1. The function of CesA2 was less obvious, but, consistent with a role in primary wall deposition, the rate of stem elongation was reduced in antisense plants growing rapidly at 31 degrees C.


Figures

Figure 1
Figure 1
Locations of gene-specific probes and antisense fragments within the conserved structure of CesA proteins. All CesA proteins have eight transmembrane (TM) domains (hatched) and the amino acid motif D,D,D,QVLRW. Regions shown in black have conserved amino acid sequence, whereas the gray regions do not (HVR, hypervariable region). Gene-specific probes were designed to the HVR1 of each gene. The length and position of the DNA fragment used in each of the antisense constructs is also shown.
Figure 2
Figure 2
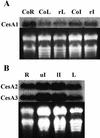
Expression patterns of CesA1, CesA2, and CesA3. Total RNA was isolated from roots (R), inflorescence (I), and rosette leaves (L) of Columbia (Co) grown at 21°C and of rsw1-1 (r) grown at 31°C. In some cases, the inflorescence material was split into upper inflorescence (uI) containing stem, meristem, buds, flowers, and cauline leaves and a lower inflorescence (lI) containing only cauline leaves and lower stem, respectively. Blots were probed with gene-specific riboprobes of CesA1 (A), CesA2, and CesA3 (B). The RNA loading is seen in the ethidium bromide-stained gels shown below. All genes are strongly expressed in all tissues, and there are no major changes in the level of CesA1 mRNA in rsw1-1.
Figure 3
Figure 3
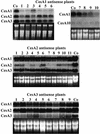
CesA gene expression in antisense plants. Total RNA from rosette leaves of T2 plants carrying antisense constructs of CesA1, CesA2, and CesA3 and from Columbia (Co) was resolved by agarose gel electrophoresis and probed with specific CesA1, CesA2, and CesA3 probes, and the gel was stained with ethidium bromide to show the loading. A probe to the CesA10 gene was also used to probe RNA from the inflorescences of some CesA1 antisense plants (lanes 7–10) and a Co control because CesA1 and CesA10 are particularly closely related. The results show (a) that only expression of the targeted CesA gene was reduced even in the case of CesA10 in CesA1 antisense plants; (b) that plants that have reverted to a wild-type phenotype (lane 3 for CesA1 antisense; lanes 3, 4, and 9 for CesA3 antisense) show much higher expression of the target gene than plants that continue to show the antisense phenotype; and (c) that CesA2 expression was successfully reduced by its antisense construct, even though only a minimal phenotype was observed.
Figure 4
Figure 4
Morphology of rosette leaves. A, Rosette leaves, and in particular petioles, from a 28-d-old wild-type plant (top row) are much bigger than those from a T2 CesA3 antisense plant. B, Rosette diameter of T3 lines, measured on d 35, show that CesA1 and CesA3 lines but not CesA2 lines are smaller than wild type (means of n ≥ 2; bars show se). The plants measured to provide the first column of the CesA3 plants are descended from the T2 plant shown in A. The reduced severity of the T3 phenotype is apparent. C through E, Cryoscanning electron micrographs showing that the complex shapes of pavement cells in wild-type plants (C) are much simpler in antisense plants carrying CesA1 (D) and CesA3 (E) constructs. F and G, Cryoscanning electron micrographs of trichomes in wild-type (F) and CesA3 antisense (G) plants. Cells at the base of the trichome are greatly swollen in antisense plants. Bar = 200 μm.
Figure 5
Figure 5
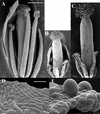
Cryoscanning electron micrographs showing flower morphology. A through C, General morphology seen after removing some sepals and petals from wild-type (A), CesA1 (B), and CesA3 (C) antisense plants. All floral organs are reduced in length in both antisense lines, but reductions in gynoecium length are less severe so that the stigma protrudes beyond the petals in the antisense plants. Bar = 500 μm. D and E, Swelling of sepal cells is seen in CesA3 antisense plants (E) but not wild-type plants (D). Bar = 50 μm.
Figure 6
Figure 6
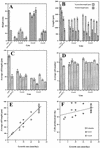
Reduced cell expansion rather than reduced cell production contributes most to organ size reduction. A, Final stem lengths (mean ± se, n ≥ 10) of wild-type and T2 antisense plants (all grown at 21°C) and of rsw1-1 plants grown at 21°C just until initiated bolts were removed, and the plants were transferred to 31°C to follow stem regrowth. CesA1 and CesA3 antisense reduces height much more than CesA2 does, although the second and third columns of CesA2 results are significantly different from wild type. B, Lengths (mean ± se, n ≥ 5) of the gynoecium and stamen filaments in CesA1 and CesA3 antisense plants, in rsw1-1 grown as above, and in wild-type Columbia plants. Antisense and rsw1-1 reduce stamen filament lengths more severely than gynoecium length. Lengths measured by cryoscanning electron microscopy. C and D, Large reductions in cell length (C) but only small reductions in cell number (D) in cell files from stamen filaments (mean ± se, n ≥ 5). E and F, Kinematic analysis of stem elongation in wild-type and CesA1 and CesA3 antisense plants. Growth rate correlates strongly with cell length (E) but only weakly with cell flux (F), the number of cells exiting the elongation zone per day. Lines fitted by linear regression with r = 0.96 in E and 0.46 in F.
Figure 7
Figure 7
Overexpression of CesA3 in rsw1-1 plants transformed with the 35S::CesA3 construct. RNA from leaves of T2 plants and of the untransformed rsw1-1 was probed with the gene-specific CesA3 riboprobe. CesA3 is overexpressed in all nine lines examined. RNA loading is shown in the lower panel.
Figure 8
Figure 8
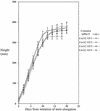
Growth in height of the stem of control and T2 antisense plants at 31°C. The heights of the stem were measured with a ruler at 2-d intervals and a mean height was calculated for at least five plants from the control and each of four antisense lines. Columbia wild-type transformed with the empty vector (Col + pBin19) was used as the control. The results show small but significant reductions in elongation rate in all four antisense lines.

References

    1. Arioli T, Peng L, Betzner AS, Burn J, Wittke W, Herth W, Camilleri C, Höfte H, Plazinski J, Birch R et al. Molecular analysis of cellulose biosynthesis in Arabidopsis. Science. 1998;279:717–720. - PubMed
    1. Baskin TI, Betzner AS, Hoggart R, Cork A, Williamson RE. Root morphology mutants in Arabidopsis thaliana. Aust J Plant Physiol. 1992;19:427–437.
    1. Bechtold N, Ellis J, Pelletier G. In planta Agrobacterium-mediated gene transfer by infiltration of adult Arabidopsis thaliana. C R Acad Sci Ser III Sci Vie. 1993;316:1194–1199.
    1. Brown RM, Jr, Saxena IM, Kudlicka K. Cellulose biosynthesis in higher plants. Trends Plant Sci. 1996;1:149–156.
    1. Datla RSS, Hammerlindl JK, Panchuk B, Pelcher LE, Keller W. Modified binary plant transformation vectors with the wild-type gene encoding NPTII. Gene. 1992;211:383–384. - PubMed

Publication types