. 2002 Jun 17;195(12):1599-611.
doi: 10.1084/jem.20011883.

Cytokine signaling and hematopoietic homeostasis are disrupted in Lnk-deficient mice

Affiliations

Cytokine signaling and hematopoietic homeostasis are disrupted in Lnk-deficient mice

Laura Velazquez et al. J Exp Med. .

Abstract

The adaptor protein Lnk, and the closely related proteins APS and SH2B, form a subfamily of SH2 domain-containing proteins implicated in growth factor, cytokine, and immunoreceptor signaling. To elucidate the physiological function of Lnk, we derived Lnk-deficient mice. Lnk(-/-) mice are viable, but display marked changes in the hematopoietic compartment, including splenomegaly and abnormal lymphoid and myeloid homeostasis. The in vitro proliferative capacity and absolute numbers of hematopoietic progenitors from Lnk(-/-) mice are greatly increased, in part due to hypersensitivity to several cytokines. Moreover, an increased synergy between stem cell factor and either interleukin (IL)-3 or IL-7 was observed in Lnk(-/-) cells. Furthermore, Lnk inactivation causes abnormal modulation of IL-3 and stem cell factor-mediated signaling pathways. Consistent with these results, we also show that Lnk is highly expressed in multipotent cells and committed precursors in the erythroid, megakaryocyte, and myeloid lineages. These data implicate Lnk as playing an important role in hematopoiesis and in the regulation of growth factor and cytokine receptor-mediated signaling.


Figures

Figure 1
Figure 1
Targeted disruption of the Lnk locus. (A) Structure of the Lnk locus (top), targeting construct (middle), and predicted Lnk mutant allele (bottom) is shown; 1 kb = 0.5 cm. (B) Southern blot analysis of EcoRV-digested ES cell-derived genomic DNA with a 3′ external probe. The wild-type (wt) fragment and the mutant (mut) allele are indicated. (C) PCR analysis of tail-derived genomic DNA from F2 mice resulting from a cross between two Lnk +/− mice with both Lnk and neo-specific primers. (D) Northern blot analysis of Lnk expression. 2 μg poly(A)+RNA from E13.5 embryos was hybridized with an NH2-terminal Lnk cDNA (top) or GAPDH probe (bottom). (E) Immunoprecipitation and Western blot analysis of spleen and testis extracts from wild-type (+/+), heterozygous (+/−), and homozygous (−/−) Lnk mice. The Lnk antibody used was raised against amino acid 72–91 of the Lnk protein. H, HindIII; X, XbaI; S, SacI; E47, EcoR47; B, BamHI; RV, EcoRV; neo, neomycin resistance cassette; TK, thymidine kinase.
Figure 2.
Figure 2.
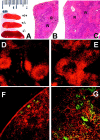
Primary splenomegaly and extramedullary hematopoiesis in Lnk / mice. (A) Gross anatomy of spleens from Lnk wild-type (top), +/− (middle), and −/− (bottom) mice. (B and C) Low power magnification (10×) of hematoxylin and eosin staining of splenic sections from wild-type (B) and Lnk −/− (C) mice showing enlargement of the white (W) and red (R) pulp. (D–G) Cryosections of spleens from wild-type (D and F) or Lnk-deficient mice (E and G) were stained with anti-B220 (red, D and E), anti-Ter119 (red, F and G), and anti-CD41 (green, F and G)–conjugated antibodies. Original magnification: 50× (D and E), 200× (F and G).
Figure 3.
Figure 3.
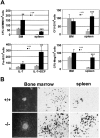
In vitro proliferative capacity of early hematopoietic progenitors in bone marrow and spleen cells from wild-type and Lnk mutant mice. (A) In vitro colony-forming ability of bone marrow and spleen hematopoietic progenitors from wild-type and Lnk-deficient mice. The mean and SD of the number of colonies/105 cells are shown from assays using three mice of each genotype in triplicate. Statistical significance was determined using the Student's t test: *, P ≤ 0.05; **, P < 0.02; ***, P < 0.01. (B) Typical appearance of pre-B (left) in IL-7 + SCF and CFU-Meg (center and right) colonies derived from wild-type and Lnk-deficient cells after 7 d of incubation in methylcellulose media containing optimal concentrations of appropriate recombinant growth factors (Materials and Methods). CFU-GEMM, colony-forming units of granulocyte, erythroid, macrophage, and megakaryocyte cells; CFU-E, precursors of small erythroid 2-d colonies; CFU-Meg, colony-forming units of megakaryocyte cells; BM, bone marrow. Scale bar: pre-B colonies, 20 μm; CFU-Meg colonies, 200 μm.
Figure 4.
Figure 4.
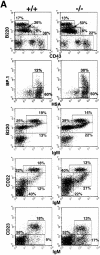
FACS analysis of Lnk-deficient B cells. Bone marrow (A) or splenic (B) cells from wild-type and Lnk-deficient mice were stained with the indicated conjugated antibodies. All panels represent lymphocyte-gated cells, with the exception of BP.1/HSA four-color staining that is gated on lymphocytes and B220+CD43+ cells. Numbers indicate percentage of gated cells in the indicated boxes. Plots are representative of three sets of mice of each genotype.
Figure 4.
Figure 4.
FACS analysis of Lnk-deficient B cells. Bone marrow (A) or splenic (B) cells from wild-type and Lnk-deficient mice were stained with the indicated conjugated antibodies. All panels represent lymphocyte-gated cells, with the exception of BP.1/HSA four-color staining that is gated on lymphocytes and B220+CD43+ cells. Numbers indicate percentage of gated cells in the indicated boxes. Plots are representative of three sets of mice of each genotype.
Figure 5.
Figure 5.
Functional analysis of Lnk / B cells. (A) Bone marrow sorted pro-B cells from wild-type and Lnk-deficient mice were cultured with the indicated concentration of IL-7 and proliferation was measured at day 4 by [3H]thymidine incorporation. The values are the mean counts per minute (±SD) of triplicate determinations. Significance was determined by Student's t test: ***, P < 0.001; **, P < 0.005; *, P < 0.02. (B and C) Splenic B cells were cultured with the indicated stimuli and proliferation was measured at day 6 (B) or day 4 (C) by [3H]thymidine incorporation. The values are the mean counts per minute (±SD) of triplicate determinations. All graphs are representative of independent experiments repeated three to five times. For each experiment, two mice per genotype were used.
Figure 6.
Figure 6.
Effect of Lnk disruption on cell proliferation in hematopoietic cells. Total bone marrow (A) or splenic cells (B) from wild-type and Lnk / mice were cultured with the indicated growth factors and proliferation was measured at day 4 (A) and day 6 (B) by an MTT assay. The values represent the mean (±SD) of triplicate determinations. (C) BMMCs from wild-type and Lnk / mice were cultured with the indicated concentrations of SCF or IL-3 for 28 h and proliferation was measured as [3H]thymidine incorporation. The values are the mean counts per minute (±SD) of triplicate determinations. All graphs are representative of two independent experiments, each done with two mice per genotype.
Figure 6.
Figure 6.
Effect of Lnk disruption on cell proliferation in hematopoietic cells. Total bone marrow (A) or splenic cells (B) from wild-type and Lnk / mice were cultured with the indicated growth factors and proliferation was measured at day 4 (A) and day 6 (B) by an MTT assay. The values represent the mean (±SD) of triplicate determinations. (C) BMMCs from wild-type and Lnk / mice were cultured with the indicated concentrations of SCF or IL-3 for 28 h and proliferation was measured as [3H]thymidine incorporation. The values are the mean counts per minute (±SD) of triplicate determinations. All graphs are representative of two independent experiments, each done with two mice per genotype.
Figure 7.
Figure 7.
Analysis of IL-3 and SCF signaling pathways in Lnk-deficient BMMCs. (A and B) BMMCs from wild-type (+/+) and Lnk mutant (−/−) mice were stimulated with 100 ng/ml IL-3 for 10 min or for the indicated times. IL-3Rβ chain was immunoprecipitated from wild-type and Lnk / BMMCs lysates and analyzed with anti-Ptyr and anti–IL-3Rβ antibodies. Whole-cell lysates were subjected to Western blot analysis with anti–phospho-Akt and anti-phospho-ERK1/2 antibodies. Anti-ERK1/2 antibodies were used to show equal loading. Normalized densitometric analysis of ERK phosphorylation is shown in B. (solid line) Wild-type; (dashed line) Lnk / . (C and D) Total BMMCs lysates were stimulated with 100 ng/ml SCF for the indicated times and then subjected to Western blot analysis with anti-Ptyr, anti-Kit, and anti–phospho-ERK1/2 antibodies. Anti-ERK1/2 antibodies were used to show similar loading. Normalized densitometric analysis of ERK phosphorylation is shown in D. (solid line) Wild-type; (dashed line) Lnk / . All data are representative of four independent experiments. Each experiment was done with cells isolated from two mice per genotype.
Figure 8.
Figure 8.
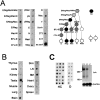
Lnk expression during hematopoiesis. (A and B) A slot blot containing either independent amplified cDNA samples from hematopoietic cells ranging from pentapotent precursors to terminally maturing cells in erythroid, myeloid, and lymphoid lineages (A) or different organs (B) was hybridized with a 3′ radiolabeled probe for Lnk. Radioactivity was quantified with a Phosphorimager (Bio-Rad Laboratories), and the results from A are shown in a hierarchy tree scheme: (black circles) high expression; (gray circles) moderate expression; (white circles) low expression. The ghosted circle represents a committed mast cell precursor stage, not actually sampled. E, erythroid; Meg, megakaryocyte; Mac or Mc, monocyte/macrophage; N, neutrophil; Mast or Mst, mast cell; B, B cells; T, T cells; BFU-E, precursors of large erythroid-only 6–8-d colonies; CFU-E, precursors of small erythroid 2-d colonies; p, precursors of 7-d colonies; pentapotent (E/Meg/Mac/N/Mst), tetrapotent (E/Meg/Mac/N), tripotent (E/Meg/Mac), and bipotent (E/Meg) precursor cells; 3T3, NIH3T3 fibroblasts; S17, stromal cell line; sc, stem cell; BM, bone marrow; LN, lymph node. (C) The same slot blots used in A and B were hybridized with the L32 probe to confirm equal loading. HC, hematopoietic cells; O, organs, same order as shown in A and B, respectively. A similar Northern blot as the one used in Fig. 1 D vas hybridized vith the 3′ Lnk probe used in A and B to confirm specificity.

Similar articles

Cited by

References

    1. Watowich, S.S., H. Wu, M. Socolovsky, U. Klingmuller, S.N. Constantinescu, and H.F. Lodish. 1996. Cytokine receptor signal transduction and the control of hematopoietic cell development. Annu. Rev. Cell Dev. Biol. 12:91–128. - PubMed
    1. Ihle, J.N. 1995. Cytokine receptor signalling. Nature. 377:591–594. - PubMed
    1. O'Shea, J.J. 1997. Jaks, STATs, cytokine signal transduction, and immunoregulation: are we there yet? Immunity. 7:1–11. - PubMed
    1. Ihle, J.N. 1996. STATs: signal transducers and activators of transcription. Cell. 84:331–334. - PubMed
    1. Ward, A.C., I. Touw, and A. Yoshimura. 2000. The Jak-Stat pathway in normal and perturbed hematopoiesis. Blood. 95:19–29. - PubMed

Publication types