. 2002 Jun 17;195(12):1653-9.
doi: 10.1084/jem.20020338.

Inducing tumor immunity through the selective engagement of activating Fcgamma receptors on dendritic cells

Affiliations

Inducing tumor immunity through the selective engagement of activating Fcgamma receptors on dendritic cells

Alexis M Kalergis et al. J Exp Med. .

Abstract

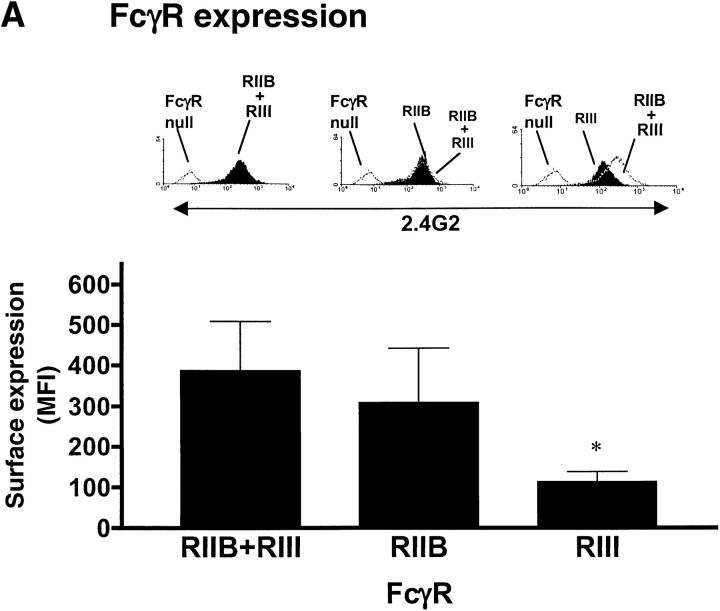
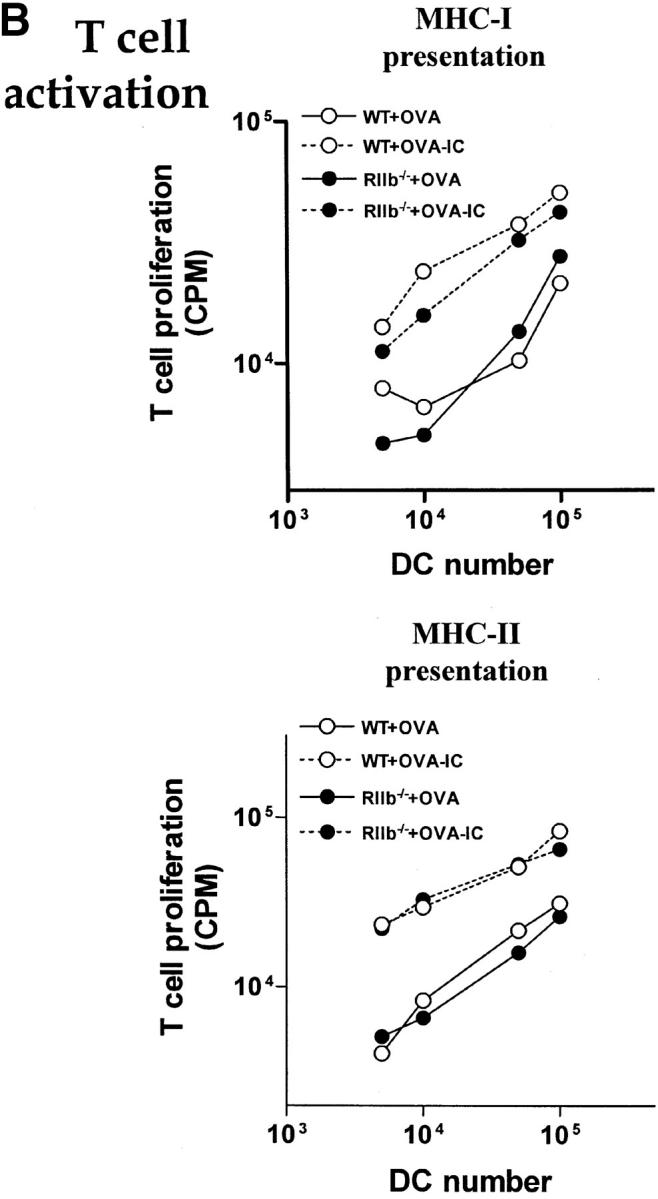
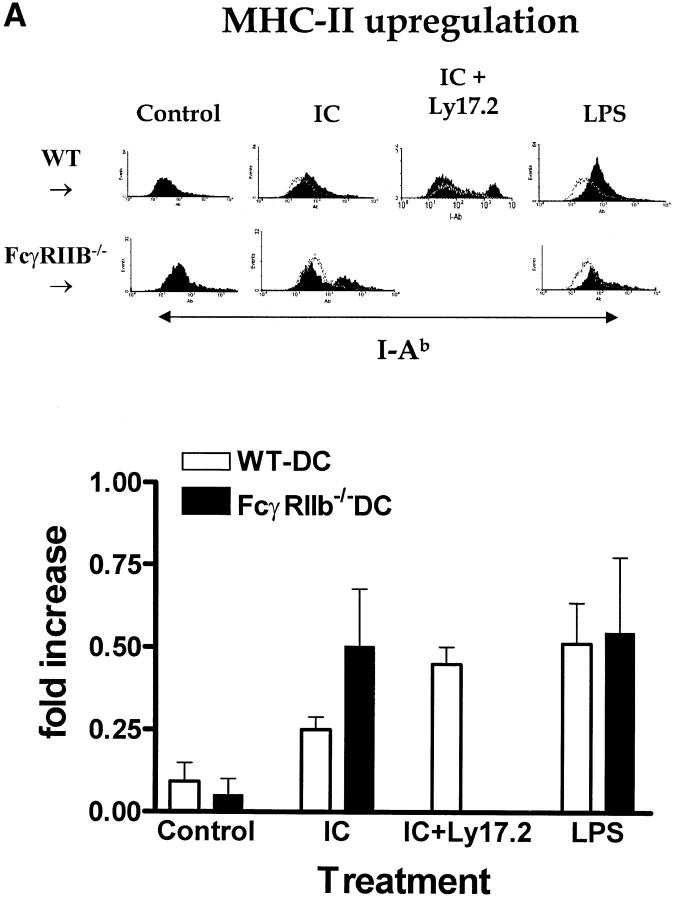
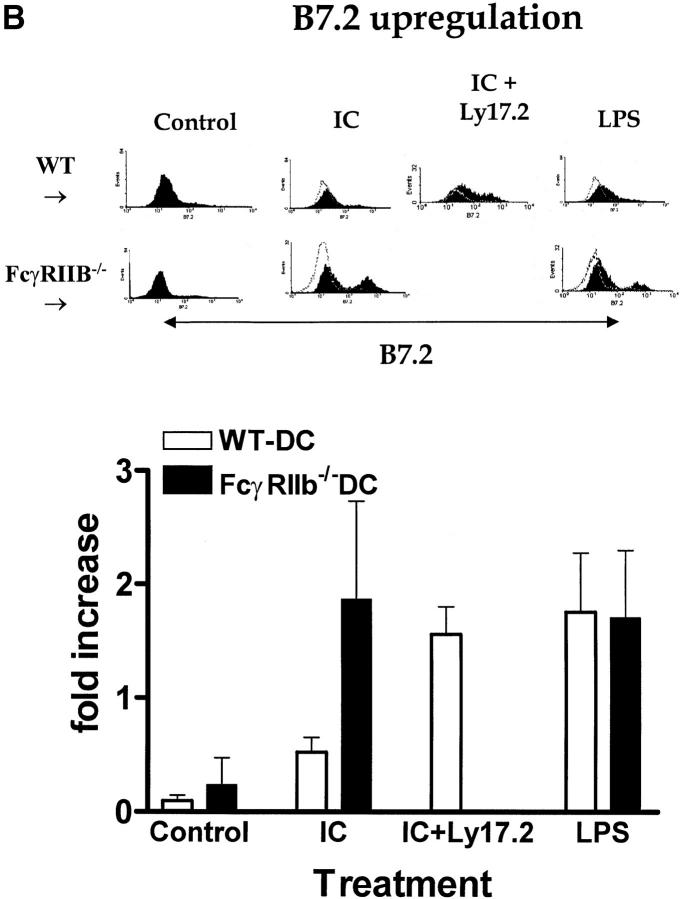
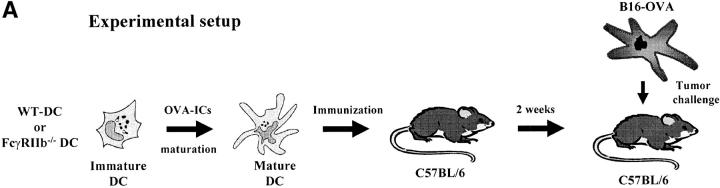
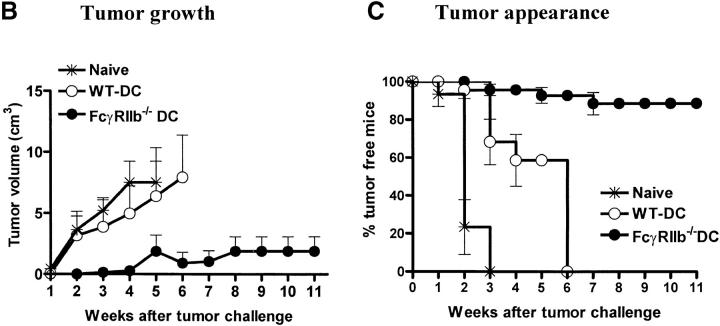
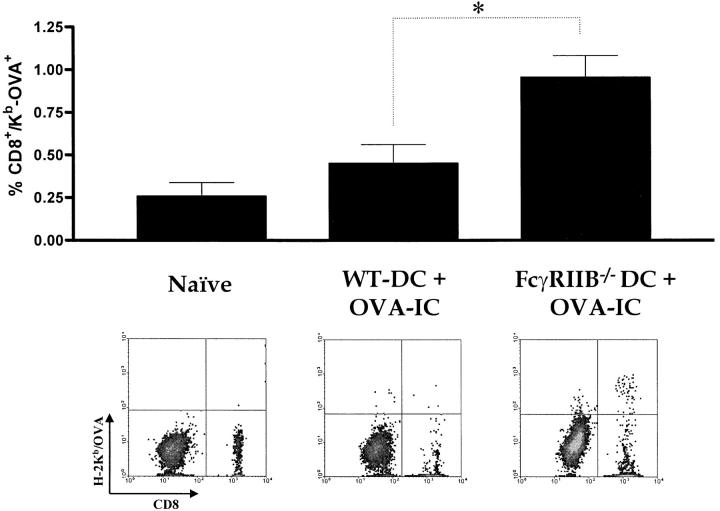
Induction of tumor-specific immunity requires that dendritic cells (DCs) efficiently capture and present tumor antigens to result in the expansion and activation of tumor-specific cytotoxic T cells. The transition from antigen capture to T cell stimulation requires a maturation signal; in its absence tolerance, rather than immunity may develop. While immune complexes (ICs) are able to enhance antigen capture, they can be poor at inducing DC maturation, naive T cell activation and protective immunity. We now demonstrate that interfering with the inhibitory signal delivered by FcgammaRIIB on DCs converts ICs to potent maturation agents and results in T cell activation. Applying this approach to immunization with DCs pulsed ex-vivo with ICs, we have generated antigen-specific CD8+ T cells in vivo and achieved efficient protective immunity in a murine melanoma model. These data imply that ICs may normally function to maintain tolerance through the binding to inhibitory FcgammaRs on DCs, but they can be converted to potent immunogenic stimuli by selective engagement of activating FcgammaRs. This mechanism suggests a novel approach to the development of tumor vaccines.


Figures

Figure 1.
Figure 1.
FcγRIIB is the predominant FcγR on the surface of dendritic cells and is not required for IC-mediated enhancement of antigen presentation. (A) Bone marrow–derived DCs were prepared as described previously (reference 24). Day 6 DC cultures derived from bone marrows of WT, γ chain−/−, and FcγRIIB−/− mice (all in the C57BL/6 background) were double-stained with anti–CD11c-PE (HL3; BD PharMingen) and 2.4G2-FITC (BD PharMingen), and analyzed by FACS®. For WT DCs, 2.4G2 binds to both FcγRIIB and FcγRIII; for γ chain−/− DCs, 2.4G2 binds to FcγRIIB only; and for FcγRIIB−/− DCs, 2.4G2 binds to FcγRIII only. Background 2.4G2 fluorescence (dotted lines) was obtained from DCs in which both FcγRIIB and γ chain have been deleted (FcγR null). One representative histogram for 2.4G2 staining is shown, gating on the CD11c+ DC population. The bar graph shows 2.4G2 mean fluorescence intensity values (CD11c+ gate) from four independent experiments (*P < 0.025); B). For the T cell priming experiments, DCs derived from bone marrows of WT or FcγRIIB−/− mice (C57BL/6 background) were pulsed for 3 h with 50 ug/ml OVA or OVA-IgG ICs. After washing, antigen-pulsed DCs (5 × 10³–105 cells per well) were cocultured with either H-2Kb/OVA– or I-Ab/OVA–specific TCR transgenic T cells, (2 × 10⁵ cells per well), purified from OT-I and OT-II mice, respectively (25, 26). At 48-h coculture cells were pulsed with 3[H]-thymidine and harvested 8 h later for determination of 3[H]-thymidine incorporation.
Figure 1.
Figure 1.
FcγRIIB is the predominant FcγR on the surface of dendritic cells and is not required for IC-mediated enhancement of antigen presentation. (A) Bone marrow–derived DCs were prepared as described previously (reference 24). Day 6 DC cultures derived from bone marrows of WT, γ chain−/−, and FcγRIIB−/− mice (all in the C57BL/6 background) were double-stained with anti–CD11c-PE (HL3; BD PharMingen) and 2.4G2-FITC (BD PharMingen), and analyzed by FACS®. For WT DCs, 2.4G2 binds to both FcγRIIB and FcγRIII; for γ chain−/− DCs, 2.4G2 binds to FcγRIIB only; and for FcγRIIB−/− DCs, 2.4G2 binds to FcγRIII only. Background 2.4G2 fluorescence (dotted lines) was obtained from DCs in which both FcγRIIB and γ chain have been deleted (FcγR null). One representative histogram for 2.4G2 staining is shown, gating on the CD11c+ DC population. The bar graph shows 2.4G2 mean fluorescence intensity values (CD11c+ gate) from four independent experiments (*P < 0.025); B). For the T cell priming experiments, DCs derived from bone marrows of WT or FcγRIIB−/− mice (C57BL/6 background) were pulsed for 3 h with 50 ug/ml OVA or OVA-IgG ICs. After washing, antigen-pulsed DCs (5 × 10³–105 cells per well) were cocultured with either H-2Kb/OVA– or I-Ab/OVA–specific TCR transgenic T cells, (2 × 10⁵ cells per well), purified from OT-I and OT-II mice, respectively (25, 26). At 48-h coculture cells were pulsed with 3[H]-thymidine and harvested 8 h later for determination of 3[H]-thymidine incorporation.
Figure 2.
Figure 2.
Removal of inhibitory Fcγ receptor signaling from DCs enhances their maturation by ICs. Day 6 DC cultures derived from bone marrows of WT C57BL/6 and FcγRIIB−/− mice were incubated for 36 h with 20 μg/ml of ICs made of OVA and anti-OVA rabbit IgG. For FcγRIIB blocking, WT DCs were incubated simultaneously with OVA-ICs and Ly17.2 mAb (supernatant from K9.361 hybridoma) (reference 27). For LPS-induced maturation, DCs were incubated with 50 ng/ml LPS. After 36-h incubation DCs were double-stained with anti–CD11c-PE (HL3; BD PharMingen) plus either anti–I-Ab-FITC (AF6–120.1; BD PharMingen, data shown in A) or anti–B7.2-FITC (GL1; BD PharMingen, data shown in B), 1 μg mAb per 5 × 10⁵ DCs, and analyzed by FACS®. Histograms show representative I-Ab or B7.2 fluorescence intensities for the CD11c+ DC population gate. Bar graphs show the increase of mean fluorescence intensity for I-Ab and B7.2 (CD11c+ gate) from four independent experiments.
Figure 2.
Figure 2.
Removal of inhibitory Fcγ receptor signaling from DCs enhances their maturation by ICs. Day 6 DC cultures derived from bone marrows of WT C57BL/6 and FcγRIIB−/− mice were incubated for 36 h with 20 μg/ml of ICs made of OVA and anti-OVA rabbit IgG. For FcγRIIB blocking, WT DCs were incubated simultaneously with OVA-ICs and Ly17.2 mAb (supernatant from K9.361 hybridoma) (reference 27). For LPS-induced maturation, DCs were incubated with 50 ng/ml LPS. After 36-h incubation DCs were double-stained with anti–CD11c-PE (HL3; BD PharMingen) plus either anti–I-Ab-FITC (AF6–120.1; BD PharMingen, data shown in A) or anti–B7.2-FITC (GL1; BD PharMingen, data shown in B), 1 μg mAb per 5 × 10⁵ DCs, and analyzed by FACS®. Histograms show representative I-Ab or B7.2 fluorescence intensities for the CD11c+ DC population gate. Bar graphs show the increase of mean fluorescence intensity for I-Ab and B7.2 (CD11c+ gate) from four independent experiments.
Figure 3.
Figure 3.
Removal of inhibitory Fcγ receptor signaling on DCs enhances their ability to protect against tumors. Day 6 DC cultures derived from bone marrows of either WT or FcγRIIB−/− mice (C57BL/6 background) were incubated for 6 h with 50 μg/ml of ICs made of OVA and anti-OVA rabbit IgG. DCs were washed in PBS and injected in the footpads of naive syngeneic C57BL/6 mice. 2 wk after this single immunization, mice were challenged subcutaneously with a variant of the melanoma B16 tumor line that expresses OVA as a neo-antigen (MO4) (references –30) (5 × 10⁵ cells per mouse). Tumor growth was monitored three times a week and data from three independent experiments are shown. (A) Scheme for DC immunization and tumor challenge. (B) Tumor growth curves for mice immunized with OVA–IC-pulsed DCs and challenged with B16-OVA (mice showing palpable tumors). While WT DCs and FcγRIIb−/− DCs are statistically different (P < 0.002), naive and WT DCs are not (P < 0.80). (C) Tumor appearance for mice immunized with OVA–ICs and challenged with B16-OVA. Mice were considered positive when palpable tumors were detected. While naive and FcγRIIb/ DCs are statistically different (P < 0.0001), naive and WT-DC are not (P < 0.079).
Figure 3.
Figure 3.
Removal of inhibitory Fcγ receptor signaling on DCs enhances their ability to protect against tumors. Day 6 DC cultures derived from bone marrows of either WT or FcγRIIB−/− mice (C57BL/6 background) were incubated for 6 h with 50 μg/ml of ICs made of OVA and anti-OVA rabbit IgG. DCs were washed in PBS and injected in the footpads of naive syngeneic C57BL/6 mice. 2 wk after this single immunization, mice were challenged subcutaneously with a variant of the melanoma B16 tumor line that expresses OVA as a neo-antigen (MO4) (references –30) (5 × 10⁵ cells per mouse). Tumor growth was monitored three times a week and data from three independent experiments are shown. (A) Scheme for DC immunization and tumor challenge. (B) Tumor growth curves for mice immunized with OVA–IC-pulsed DCs and challenged with B16-OVA (mice showing palpable tumors). While WT DCs and FcγRIIb−/− DCs are statistically different (P < 0.002), naive and WT DCs are not (P < 0.80). (C) Tumor appearance for mice immunized with OVA–ICs and challenged with B16-OVA. Mice were considered positive when palpable tumors were detected. While naive and FcγRIIb/ DCs are statistically different (P < 0.0001), naive and WT-DC are not (P < 0.079).
Figure 4.
Figure 4.
FcγRIIB/ DCs efficiently induce expansion of antigen-specific CD8+ T cells. Peripheral blood cells obtained 2 wk after challenging mice with B16-OVA tumor, were double stained with anti–CD8α-FITC (53–6.7; BD PharMingen) and H-2Kb/OVA-PE tetramers. Tetramer staining was done at 4°C, for 1 h with 1 μg of anti-CD8α and tetramers per 106 cells. H-2Kb/OVA tetramers carried the immunodominant OVA peptide SIINFEKL and were designed as described previously (references and 32). (Left) Naive C57BL/6 mice; (middle) C57BL/6 mice immunized with WT DCs pulsed with OVA-IgG ICs; (right) C57BL/6 mice immunized with FcγRIIB−/− DC pulsed with OVA-IgG ICs. *P < 0.02.

Similar articles

Cited by

References

    1. LaTemple, D.C., J.T. Abrams, S.Y. Zhang, and U. Galili. 1999. Increased immunogenicity of tumor vaccines complexed with anti-Gal: studies in knockout mice for α1,3galactosyltransferase. Cancer Res. 59:3417–3423. - PubMed
    1. Dhodapkar, K.M., J. Krasovsky, B. Williamson, and M.V. Dhodapkar. 2002. Antitumor monoclonal antibodies enhance cross-presentation of cellular antigens and the generation of myeloma-specific killer T cells by dendritic cells. J. Exp. Med. 195:125–133. - PMC - PubMed
    1. Banchereau, J., F. Briere, C. Caux, J. Davoust, S. Lebecque, Y.J. Liu, B. Pulendran, and K. Palucka. 2000. Immunobiology of dendritic cells. Annu. Rev. Immunol. 18:767–811. - PubMed
    1. Fong, L., and E.G. Engleman. 2000. Dendritic cells in cancer immunotherapy. Annu. Rev. Immunol. 18:245–273. - PubMed
    1. Lanzavecchia, A., and F. Sallusto. 2001. Regulation of T cell immunity by dendritic cells. Cell. 106:263–266. - PubMed

Publication types