. 2002 Jun;109(12):1587-98.
doi: 10.1172/JCI15034.

APRIL modulates B and T cell immunity

Affiliations

APRIL modulates B and T cell immunity

Jens V Stein et al. J Clin Invest. 2002 Jun.

Abstract

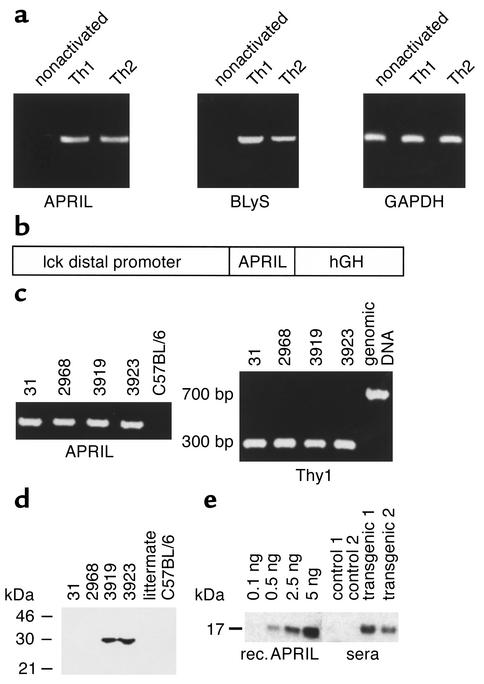
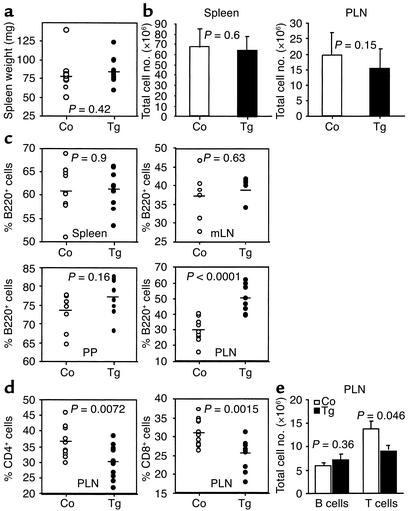
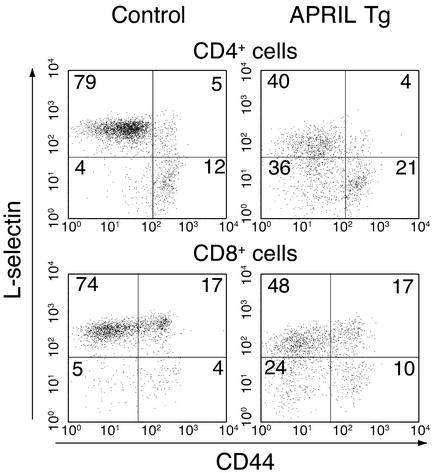
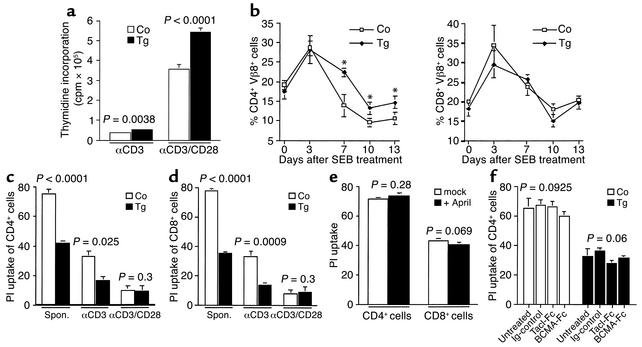
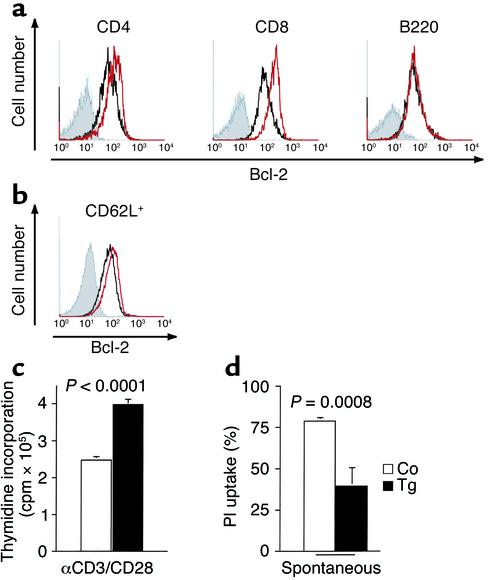
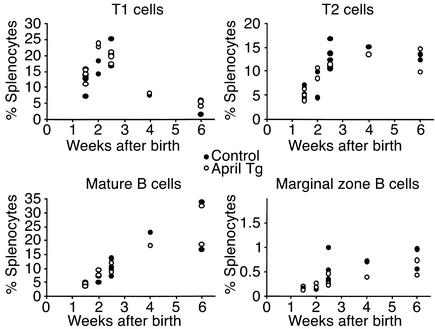
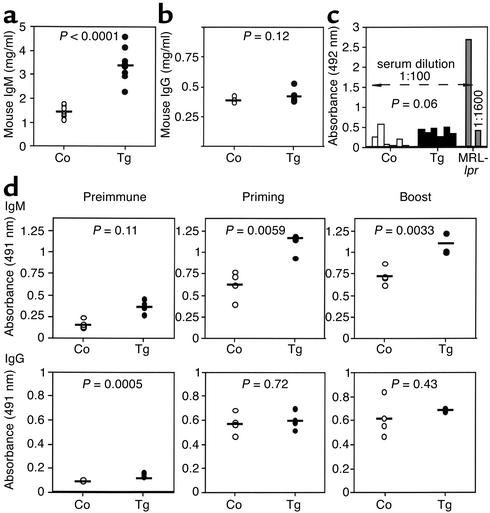
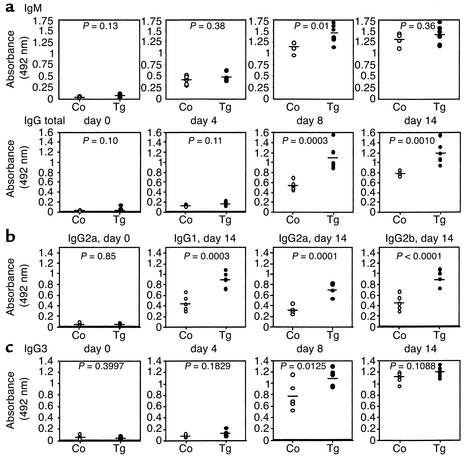
The TNF-like ligands APRIL and BLyS are close relatives and share the capacity to bind the receptors TACI and BCMA. BLyS has been shown to play an important role in B cell homeostasis and autoimmunity, but the biological role of APRIL remains less well defined. Analysis of T cells revealed an activation-dependent increase in APRIL mRNA expression. We therefore generated mice expressing APRIL as a transgene in T cells. These mice appeared normal and showed no signs of B cell hyperplasia. Transgenic T cells revealed a greatly enhanced survival in vitro as well as enhanced survival of staphylococcal enterotoxin B-reactive CD4+ T cells in vivo, which both directly correlate with elevated Bcl-2 levels. Analysis of humoral responses to T cell-dependent antigens in the transgenic mice indicated that APRIL affects only IgM but not IgG responses. In contrast, T cell-independent type 2 (TI-2) humoral response was enhanced in APRIL transgenic mice. As TACI was previously reported to be indispensable for TI-2 antibody formation, these results suggest a role for APRIL/TACI interactions in the generation of this response. Taken together, our data indicate that APRIL is involved in the induction and/or maintenance of T and B cell responses.


Figures

Figure 1
Figure 1
(a) APRIL expression in activated, but not in naive, T cells. Activated T cells have increased APRIL mRNA expression levels. DO11.10 spleen CD4+ T cells were isolated and activated in vitro toward a Th1 or Th2 phenotype. RNA was prepared from naive, Th1, and Th2 cells and used to analyze the expression of APRIL, BLyS, and GAPDH by RT-PCR. Generation and characterization of APRIL Tg mice. (b) Schematic diagram of constructs used for peripheral T cell–specific expression of the human APRIL transgene. (c) mRNA expression of APRIL in T cells of four different founders. RNA was prepared from purified T cells derived from spleen and lymph nodes of four Tg mice and analyzed by RT-PCR for APRIL RNA expression levels. To ensure that the amplified human APRIL signal was not due to contaminating genomic DNA, cDNA probes were amplified for Thy1 using primers that amplify a 300-bp fragment of cDNA and a 700-bp fragment of genomic DNA (genomic mouse DNA was used as control). (d) Protein expression of APRIL in Tg mouse T cells. Cell lysates were prepared from purified T cells derived from spleen and lymph nodes of four Tg mice, a control littermate, and a C57BL/6 mouse and analyzed in Western blot using anti-human APRIL antibodies (8). (e) Secreted APRIL circulates in serum of APRIL Tg mice. Sera (1 μl) of control and Tg mice were resolved under nonreducing conditions and immunoblots developed with anti-human APRIL antibodies. Recombinant (Rec.) APRIL protein (0.1–5 ng) added to control serum was used as standard.
Figure 2
Figure 2
B and T cell homeostasis in APRIL Tg mice. (a) Unaltered spleen weight in APRIL Tg mice. Spleen weight of mice was measured at the age of 6–12 weeks (n = 12). (b) Unaltered splenocyte and peripheral lymph node cell number in APRIL Tg mice. Splenocyte number was determined in 6- to 12-week-old mice (n = 11). Data represent the mean ± SD. (c) Evaluation of B cell percentage (B220+ cells) in spleen, mesenteric lymph nodes (MLN), Peyer’s patches (PP), and peripheral lymph nodes (PLN) (n = 10). (d) Percentage of CD4+ and CD8+ T cell populations in peripheral lymph nodes of APRIL Tg mice (n = 10; 6–12 weeks old). (e) Comparison of absolute B and T cell numbers in peripheral lymph nodes (n = 10). Data are the mean ± SM. The statistical significance of the data was determined using ANOVA. P > 0.05 is considered insignificant, P < 0.05 significant, P < 0.01 very significant, and P < 0.0001 extremely significant. Co, control.
Figure 3
Figure 3
Decreased CD62L (L-selectin) expression in splenic T cells is not accompanied by CD44 upregulation. CD62L versus CD44 expression is shown gated on CD4 and CD8 populations. Downregulation of CD62L was seen in T cells of blood and secondary lymphoid organs; it was already apparent in Tg mouse spleen at 2 weeks of age and was maintained throughout their lives (not shown).
Figure 4
Figure 4
Increased proliferation of T cells and survival of T cells from APRIL Tg mice in vitro. (a) Increased proliferation of Tg T cells after 2 days’ culturing with anti-CD3 alone, or anti-CD3 in combination with anti-CD28. (b) T cell response in APRIL Tg mice in vivo: Delayed deletion of superantigen-responsive Vβ8+ CD4+ cells in APRIL Tg mice. PBLs were stained for CD4, CD8, and Vβ8 on the days indicated (n = 4). This is one representative experiment of four performed. ANOVA confirmed that the differences for CD4+ cells at days 7, 10, and 13 are statistically significant (Table 2). *P < 0.05. The Vβ6+ subpopulation of CD4+ and CD8+ cells was unresponsive at all time points analyzed (not shown). (c and d) Survival of purified T cells cultured for 3 days alone, with anti-CD3, or with anti-CD3 plus anti-CD28. Cells were stained for CD4 (c) or CD8 (d) and PI as described in Methods. (e) Purified T cells of C57BL/6 mice were cultured for 2 days without stimulation, alone or in the presence of 5 μg/ml recombinant APRIL, and PI-stained. (f) Purified CD4+ T cells were cultured for 3 days without stimulation, alone or in the presence of 50 μg/ml of TACI-Fc, BMCA-Fc, or control Ig. Similar results were obtained for CD8+ T cells. All data in a and cf are the mean ± SD of triplicate determinations of a representative experiment of at least three performed. The statistical significance of the data was determined using ANOVA.
Figure 5
Figure 5
T cells of Tg mice have increased Bcl-2 levels. (a) Increased Bcl-2 expression in CD4+ and CD8+ T cells, but not B cells of APRIL Tg mice. Ex vivo CD4+ and CD8+ T cells and B220+ B cells from peripheral lymph nodes were analyzed for Bcl-2 expression as described in Methods. Staining in cells of control littermates is shown in black (gray shadow for isotype control, no shadow for Bcl-2 staining); blue shows isotype control, and red shows Bcl-2 in cells of Tg’s. One representative staining of four is shown. The average increase in Bcl-2 mean fluorescence intensity was 1.5 ± 0.19–fold in Tg CD4 cells (mean ± SD, n = 4), 1.8 ± 0.4–fold in CD8 cells, and 1.1 ± 0.05–fold in B220+ cells. (b) Increased Bcl-2 expression in sorted CD62L+ T cells of Tg mice. Staining in cells of control littermates is shown in black (gray shadow for isotype control, no shadow for Bcl-2 staining); blue shows isotype control, and red shows Bcl-2 in cells of Tg’s. One representative staining of three is shown. (c) T cell proliferation of sorted CD62L+ T cells after 2 days’ culture with anti-CD3 in combination with anti-CD28. (d) Survival of sorted CD62L+ T cells cultured for 3 days without stimulation. Data in c and d are the mean ± SD of triplicate determinations of a representative experiment of at least three performed. The statistical significance of the data was determined using ANOVA.
Figure 6
Figure 6
Ectopic APRIL expression does not influence B cell development in spleen. Splenocytes were analyzed for their content of T1 (IgMbright CD21 CD23), T2 (IgMbright CD21bright CD23+), mature (IgM+ CD21bright CD23+), and marginal zone (IgMbright CD21bright CD23-) B cells (n = 20).
Figure 7
Figure 7
Moderate alteration of serum Ig levels and T cell–dependent humoral responses in APRIL Tg mice. Comparison of IgM (a) and IgG (b) levels in APRIL Tg mice (n = 10 in a; n = 6 in b). (c) Anti-DNA autoantibodies were not elevated in APRIL Tg mice. For comparison, pooled sera of five MRL-lpr mice were used at the same dilution (1:100) as those of APRIL Tg mice and littermates, and at a 1:1,600 dilution to obtain a comparable OD value. (d) T cell–dependent humoral response to a modified version of attenuated Ankara-strain vaccinia virus (rMVA) in APRIL Tg mice (n = 4). Serum IgM and IgG levels from 8-week-old mice before immunization (preimmune), 15 days after immunization (priming), and 15 days after second immunization (boost). Statistical significance was determined using ANOVA.
Figure 8
Figure 8
TI-2 humoral response in APRIL Tg mice. Groups (n = 6) of APRIL Tg mice and littermates were immunized with 30 μg NP-Ficoll, a TI-2 antigen, and serum Ig levels were determined by ELISA. (a) IgM and total IgG response to NP-Ficoll. (b) Distribution of IgG1, IgG2a, and IgG2b isotypes. For comparison, IgG2a levels of preimmune sera are shown; similar values were obtained for IgG1 and IgG2b levels in preimmune sera. (c) IgG3 response to NP-Ficoll. The statistical significance of the data was determined using ANOVA.

Similar articles

Cited by

References

    1. Smith CA, Farrah T, Goodwin RG. The TNF receptor superfamily of cellular and viral proteins: activation, costimulation, and death. Cell. 1994;76:959–962. - PubMed
    1. Hahne M, et al. APRIL, a new ligand of the tumor necrosis factor family, stimulates tumor cell growth. J Exp Med. 1998;188:1185–1190. - PMC - PubMed
    1. Moore PA, et al. BLyS: member of the tumor necrosis factor family and B lymphocyte stimulator. Science. 1999;285:260–263. - PubMed
    1. Schneider P, et al. BAFF, a novel ligand of the tumor necrosis factor family, stimulates B cell growth. J Exp Med. 1999;189:1747–1756. - PMC - PubMed
    1. Mukhopadhyay A, Ni J, Zhai Y, Yu GL, Aggarwal BB. Identification and characterization of a novel cytokine, THANK, a TNF homologue that activates apoptosis, nuclear factor-kappaB, and c-Jun NH2-terminal kinase. J Biol Chem. 1999;274:15978–15981. - PubMed

Publication types

MeSH terms

Substances