Equilibrium denaturation studies of the Escherichia coli factor for inversion stimulation: implications for in vivo function
- PMID: 12070319
- PMCID: PMC2373661
- DOI: 10.1110/ps.5050102
Equilibrium denaturation studies of the Escherichia coli factor for inversion stimulation: implications for in vivo function
Abstract
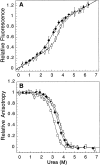
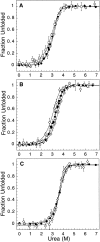
The Factor for Inversion Stimulation (FIS) is a dimeric DNA binding protein found in enteric bacteria that is involved in various cellular processes, including stimulation of certain specialized DNA recombination events and transcription regulation of a large number of genes. The intracellular FIS concentration, when cells are grown in rich media, varies dramatically during the early logarithmic growth phase. Its broad range of concentrations could potentially affect the nature of its quaternary structure, which in turn, could affect its ability to function in vivo. Thus, we examined the stability of FIS homodimers under a wide range of concentrations relevant to in vivo expression levels. Its urea-induced equilibrium denaturation was monitored by far- and near-UV circular dichroism (CD), tyrosine fluorescence, and tyrosine fluorescence anisotropy. The denaturation transitions obtained were concentration-dependent and showed similar midpoints (C(m)) and m values, suggesting a two-state denaturation process involving the native dimer and unfolded monomers (N(2) <--> 2U). The DeltaG(H(2)O) for the unfolding of FIS determined from global and individual curve fitting was 14.2 kcal/mole. At concentrations <9 microM, the FIS dimer began to dissociate, as noted by the change in CD signal and size-exclusion high-pressure liquid chromatography retention times and peak width. The estimated dimer dissociation constant based on the CD and size-exclusion chromatography data is in the micromolar range, resulting in a DeltaG(H(2)O) of at least 5 kcal/mole less than that calculated from the urea denaturation data. This discrepancy suggests a deviation from a two-state denaturation model, perhaps due to a marginally stable monomeric intermediate. These observations have implications for the stability and function of FIS in vivo.
Figures


Similar articles
-
The role of the local environment of engineered Tyr to Trp substitutions for probing the denaturation mechanism of FIS.Protein Sci. 2011 Feb;20(2):302-12. doi: 10.1002/pro.561. Protein Sci. 2011. PMID: 21280122 Free PMC article.
-
From two-state to three-state: the effect of the P61A mutation on the dynamics and stability of the factor for inversion stimulation results in an altered equilibrium denaturation mechanism.Biochemistry. 2002 Nov 19;41(46):13744-54. doi: 10.1021/bi0265224. Biochemistry. 2002. PMID: 12427037
-
Folding mechanism of FIS, the intertwined, dimeric factor for inversion stimulation.J Mol Biol. 2004 Jan 23;335(4):1065-81. doi: 10.1016/j.jmb.2003.11.013. J Mol Biol. 2004. PMID: 14698300
-
A truncated peptide model of the mutant P61A FIS forms a stable dimer.Biochim Biophys Acta. 2007 Jan;1774(1):78-85. doi: 10.1016/j.bbapap.2006.09.012. Epub 2006 Sep 27. Biochim Biophys Acta. 2007. PMID: 17118726
-
The location of an engineered inter-subunit disulfide bond in factor for inversion stimulation (FIS) affects the denaturation pathway and cooperativity.Biochemistry. 2006 Aug 15;45(32):9767-77. doi: 10.1021/bi060672n. Biochemistry. 2006. PMID: 16893178
Cited by
-
The role of the local environment of engineered Tyr to Trp substitutions for probing the denaturation mechanism of FIS.Protein Sci. 2011 Feb;20(2):302-12. doi: 10.1002/pro.561. Protein Sci. 2011. PMID: 21280122 Free PMC article.
-
Mechanism of chromosome compaction and looping by the Escherichia coli nucleoid protein Fis.J Mol Biol. 2006 Dec 8;364(4):777-98. doi: 10.1016/j.jmb.2006.09.043. Epub 2006 Sep 22. J Mol Biol. 2006. PMID: 17045294 Free PMC article.
-
Quantification of the thermodynamically linked quaternary and tertiary structural stabilities of transthyretin and its disease-associated variants: the relationship between stability and amyloidosis.Biochemistry. 2008 Jul 1;47(26):6969-84. doi: 10.1021/bi800636q. Epub 2008 Jun 7. Biochemistry. 2008. PMID: 18537267 Free PMC article.
-
The Denaturant- and Mutation-Induced Disassembly of Pseudomonas aeruginosa Hexameric Hfq Y55W Mutant.Molecules. 2022 Jun 14;27(12):3821. doi: 10.3390/molecules27123821. Molecules. 2022. PMID: 35744948 Free PMC article.
-
Geofold: topology-based protein unfolding pathways capture the effects of engineered disulfides on kinetic stability.Proteins. 2012 Mar;80(3):920-34. doi: 10.1002/prot.23249. Epub 2011 Dec 21. Proteins. 2012. PMID: 22189917 Free PMC article.
References
-
- Abril, A.M., Salas, M., Andreu, J.M., Hermoso, J.M., and Rivas, G. 1997. Phage phi29 protein p6 is in a monomer–dimer equilibrium that shifts to higher association states at the millimolar concentrations found in vivo. Biochemistry 36 11901–11908. - PubMed
-
- Azuma, T. and Hamaguchi, K. 1976. The mechanism of reassembly of immunoglobulin G. J. Biochem. (Tokyo) 80 1023–1038. - PubMed
Publication types
MeSH terms
Substances
Grants and funding
LinkOut - more resources
Full Text Sources

