

In search for more accurate alignments in the twilight zone
- PMID: 12070323
- PMCID: PMC2373660
- DOI: 10.1110/ps.4820102
In search for more accurate alignments in the twilight zone
Abstract
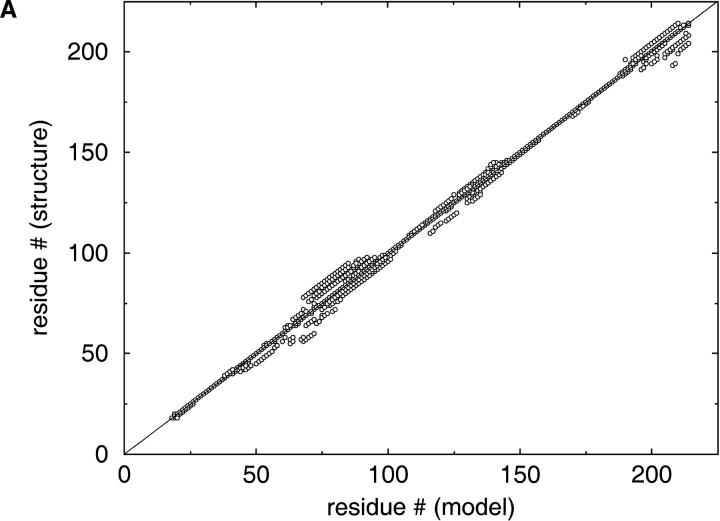
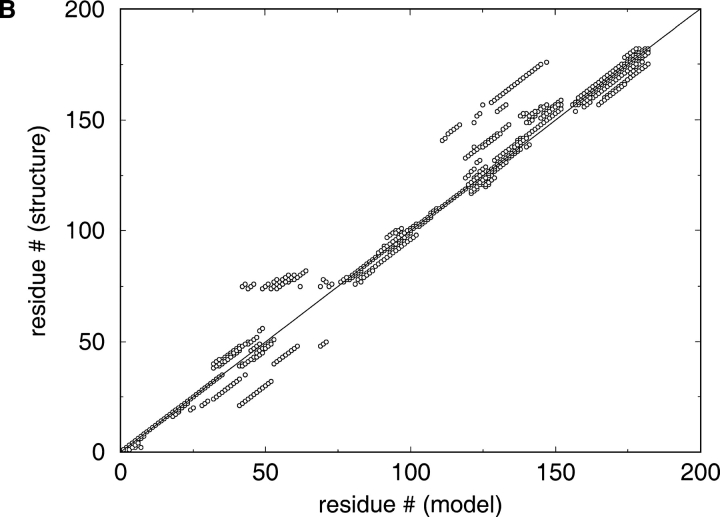
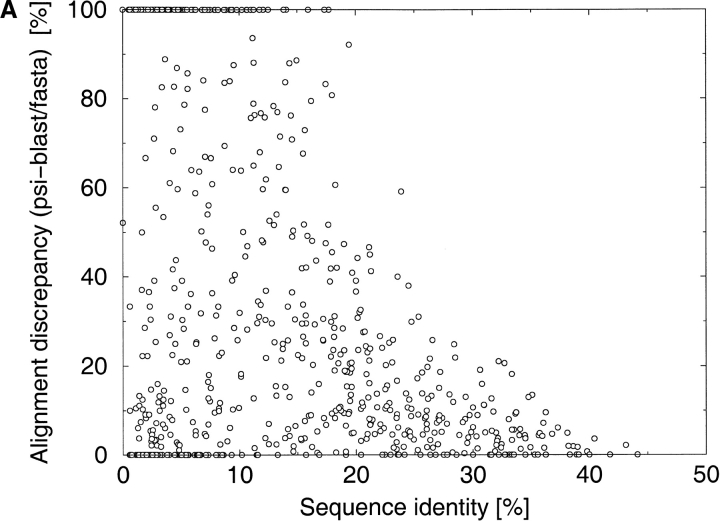
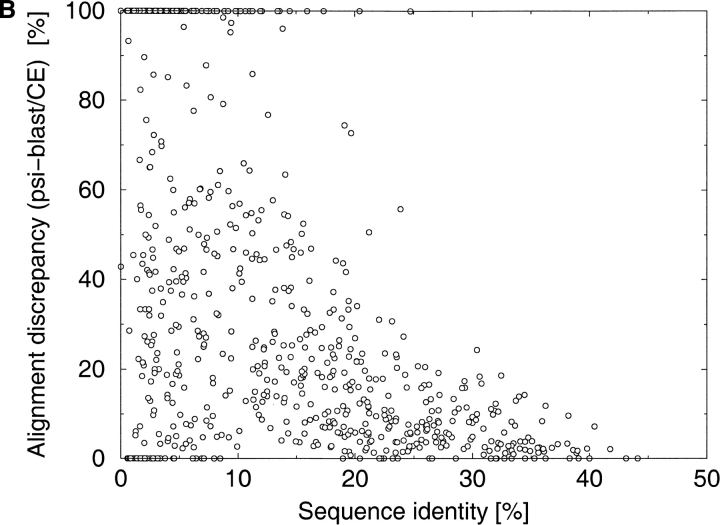
A major bottleneck in comparative modeling is the alignment quality; this is especially true for proteins whose distant relationships could be reliably recognized only by recent advances in fold recognition. The best algorithms excel in recognizing distant homologs but often produce incorrect alignments for over 50% of protein pairs in large fold-prediction benchmarks. The alignments obtained by sequence-sequence or sequence-structure matching algorithms differ significantly from the structural alignments. To study this problem, we developed a simplified method to explicitly enumerate all possible alignments for a pair of proteins. This allowed us to estimate the number of significantly different alignments for a given scoring method that score better than the structural alignment. Using several examples of distantly related proteins, we show that for standard sequence-sequence alignment methods, the number of significantly different alignments is usually large, often about 10(10) alternatives. This distance decreases when the alignment method is improved, but the number is still too large for the brute force enumeration approach. More effective strategies were needed, so we evaluated and compared two well-known approaches for searching the space of suboptimal alignments. We combined their best features and produced a hybrid method, which yielded alignments that surpassed the original alignments for about 50% of protein pairs with minimal computational effort.
Figures
Similar articles
-
Improving the quality of twilight-zone alignments.Protein Sci. 2000 Aug;9(8):1487-96. doi: 10.1110/ps.9.8.1487. Protein Sci. 2000. PMID: 10975570 Free PMC article.
-
Application of protein structure alignments to iterated hidden Markov model protocols for structure prediction.BMC Bioinformatics. 2006 Sep 14;7:410. doi: 10.1186/1471-2105-7-410. BMC Bioinformatics. 2006. PMID: 16970830 Free PMC article.
-
From analysis of protein structural alignments toward a novel approach to align protein sequences.Proteins. 2004 Feb 15;54(3):569-82. doi: 10.1002/prot.10503. Proteins. 2004. PMID: 14748004
-
Sequence comparison and protein structure prediction.Curr Opin Struct Biol. 2006 Jun;16(3):374-84. doi: 10.1016/j.sbi.2006.05.006. Epub 2006 May 19. Curr Opin Struct Biol. 2006. PMID: 16713709 Review.
-
Upcoming challenges for multiple sequence alignment methods in the high-throughput era.Bioinformatics. 2009 Oct 1;25(19):2455-65. doi: 10.1093/bioinformatics/btp452. Epub 2009 Jul 30. Bioinformatics. 2009. PMID: 19648142 Free PMC article. Review.
Cited by
-
Improving the quality of protein structure models by selecting from alignment alternatives.BMC Bioinformatics. 2006 Jul 27;7:364. doi: 10.1186/1471-2105-7-364. BMC Bioinformatics. 2006. PMID: 16872519 Free PMC article.
-
Distance matrix-based approach to protein structure prediction.J Struct Funct Genomics. 2009 Mar;10(1):67-81. doi: 10.1007/s10969-009-9062-2. Epub 2009 Feb 18. J Struct Funct Genomics. 2009. PMID: 19224393 Free PMC article.
-
All are not equal: a benchmark of different homology modeling programs.Protein Sci. 2005 May;14(5):1315-27. doi: 10.1110/ps.041253405. Protein Sci. 2005. PMID: 15840834 Free PMC article.
-
ProbCons: Probabilistic consistency-based multiple sequence alignment.Genome Res. 2005 Feb;15(2):330-40. doi: 10.1101/gr.2821705. Genome Res. 2005. PMID: 15687296 Free PMC article.
-
Spatiotemporal control of spindle midzone formation by PRC1 in human cells.Proc Natl Acad Sci U S A. 2006 Apr 18;103(16):6196-201. doi: 10.1073/pnas.0506926103. Epub 2006 Apr 7. Proc Natl Acad Sci U S A. 2006. PMID: 16603632 Free PMC article.
References
-
- Berman, H.M., Bhat, T.N., Bourne, P.E., Feng, Z., Gilliland, G., Weissig, H., and Westbrook, J. 2000. The Protein Data Bank and the challenge of structural genomics. Nat. Struct. Biol. 7 957–959. - PubMed
-
- Burley, S.K., Almo, S.C., Bonanno, J.B., Capel, M., Chance, M.R., Gaasterland, T., Lin, D., Sali, A., Studier, F.W., and Swaminathan, S. 1999. Structural genomics: Beyond the human genome project. Nat. Genet. 23151–157. - PubMed
-
- CASP4. Fourth Meeting on the Critical Assessment of Techniques for Protein Structure Prediction. 2000. Asilomar, Pacific Grove, CA.
Publication types
MeSH terms
Grants and funding
LinkOut - more resources
Full Text Sources
Other Literature Sources
