. 2002 Jun 25;99(13):8473-8.
doi: 10.1073/pnas.122040599. Epub 2002 Jun 17.

Inverting dynamic force microscopy: from signals to time-resolved interaction forces

Affiliations

Inverting dynamic force microscopy: from signals to time-resolved interaction forces

Martin Stark et al. Proc Natl Acad Sci U S A. .

Abstract

Transient forces between nanoscale objects on surfaces govern friction, viscous flow, and plastic deformation, occur during manipulation of matter, or mediate the local wetting behavior of thin films. To resolve transient forces on the (sub) microsecond time and nanometer length scale, dynamic atomic force microscopy (AFM) offers largely unexploited potential. Full spectral analysis of the AFM signal completes dynamic AFM. Inverting the signal formation process, we measure the time course of the force effective at the sensing tip. This approach yields rich insight into processes at the tip and dispenses with a priori assumptions about the interaction, as it relies solely on measured data. Force measurements on silicon under ambient conditions demonstrate the distinct signature of the interaction and reveal that peak forces exceeding 200 nN are applied to the sample in a typical imaging situation. These forces are 2 orders of magnitude higher than those in covalent bonds.


Figures

Figure 1
Figure 1
The flow diagram represents dynamic AFM, the setup is sketched in the Inset. Conceiving the AFM as sensor, it converts the force input f(x, t) into the signal output s(x, x′, t) in a linear manner (upper branch; t time, x position of the acting force, x′ position of measurement). The interaction between tip and sample obeys a nonlinear force-distance relation (lower, back-coupled branch). Physically, the cantilever is externally excited to oscillate and interacts once every cycle with the sample that is mounted on a scan-piezo. The deflection of the cantilever is measured by a laser, reflected from the backside of the cantilever onto a position-sensitive photodiode.
Figure 2
Figure 2
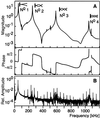
In the framework of linear response theory, the conversion of input into output is described by the transfer function of the AFM. (A) The transfer function was measured for the used configuration with a bandwidth of 1.2 MHz. Eigenmode resonances of this multimodal resonator are indicated. (B) The depicted amplitude spectrum of the signal (normalized to the free oscillation) was obtained on silicon at an average tip-sample separation corresponding to 44.6% of the free amplitude. The periodic contact of the AFM tip with the silicon sample introduces higher harmonics that couple to the eigenmode resonances. In general, eigenmodes resonances are not harmonics of the fundamental oscillation. Note the noise level.
Figure 3
Figure 3
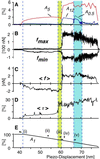
Several parameters are shown, characterizing the tapping-mode approach curve on silicon under ambient conditions. (A) Signal amplitudes A5 and A12 (fifth and 12th harmonic to the fundamental frequency ω1 = 2π 46.2 kHz, respectively) indicate excitation of vertical eigenmodes 2 and 3, the appearance of contributions at 0.5 ω1 marks period doubling. (B) Maximal forces fmax reach +200 nN (repulsive force), whereas minimal forces fmin (attractive force) become more pronounced with the onset of mechanical contact (−40 nN to −100 nN). (C) Along with this transition, the force averaged over one cycle 〈f〉 changes sign, but remains within ±2 nN. (D) The average duration of the interaction 〈τ〉 increases from 7% for purely attractive interaction to more than 25% for repulsive dominated interaction. (E) For orientation, the amplitude A1 at the excitation frequency ω1 is given. It decreases linearly with decreasing mean tip-sample distance. The distinct regimes and transitions are marked i–v. The arrows point to the positions where the events of Fig. 5A were taken.
Figure 4
Figure 4
Approach curves simulated with a single degree of freedom based on a Derjaguin–Müller–Toporov contact model (with the parameters given in Table 1.) are shown vs. the tip-sample separation. (A) Forces averaged over one cycle reach approximately 2 nN. (B) Maximum and minimum forces (fmax and fmin, respectively) were determined by a peak detection algorithm. While the maximum forces fits reasonable well to the experimental data, the minimum forces (i.e., the attractive forces) deviate remarkably from the experiment: the simulation does not account for the dissipative forces occurring in the experiment. (C) The depicted tapping amplitude A was derived from the peak-to-peak values.
Figure 5
Figure 5
The time course of reconstructed force f(t) and measured signal s(t) (below the force graphs, scale bars indicate the free signal amplitude) are shown for representative impact events, extracted from the positions marked i–v in Fig. 3E. The events are (i) free oscillation, (ii) purely attractive interaction, and (iii) onset of contact. (iv) As the tip enters deeply into the interaction potential, repulsive forces become predominant and exceed +200 nN (note the scale). At the same time, attractive forces increase quite dramatically, and the total duration of the interaction pulse rises to 3.5 μs, confirming earlier results obtained with a different method (19). The impact follows a typical sequence of attractive, repulsive, and again attractive force, just as in the case of a quasi-static force curve. (v) For a certain set of parameters the nonlinearity in the effective external force can result in period doubling, and thus in a characteristic oscillation of the force pattern (note the different time scale). Even in this case, we consider the cantilever itself still a linear sensor. (B) Comparing the impact event obtained on silicon with that on PTFE measured with the identical tip under comparable conditions reveals material dependence (note the different force scales). Whereas a large attractive force precedes the mechanical contact on silicon, the tip touches the PTFE surface almost immediately (see *). This difference in the transient force points to the influence of surface wetting on silicon.

Similar articles

Cited by

References

    1. Ferry J D. Viscoelastic Properties of Polymers. New York: Wiley; 1980.
    1. Wilhelm M. Macromol Mater Eng. 2002;287:83–105.
    1. Evans E, Ritchie K. Biophys J. 1997;72:1541–1555. - PMC - PubMed
    1. Binnig G, Quate C F, Gerber C. Phys Rev Lett. 1986;56:930–933. - PubMed
    1. Friedbacher G, Fuchs H. Pure Appl Chem. 1999;71:1337–1357.

Publication types

MeSH terms

LinkOut - more resources