

Objective comparison of quantitative imaging modalities without the use of a gold standard
- PMID: 12071615
- PMCID: PMC3150581
- DOI: 10.1109/TMI.2002.1009380
Objective comparison of quantitative imaging modalities without the use of a gold standard
Abstract
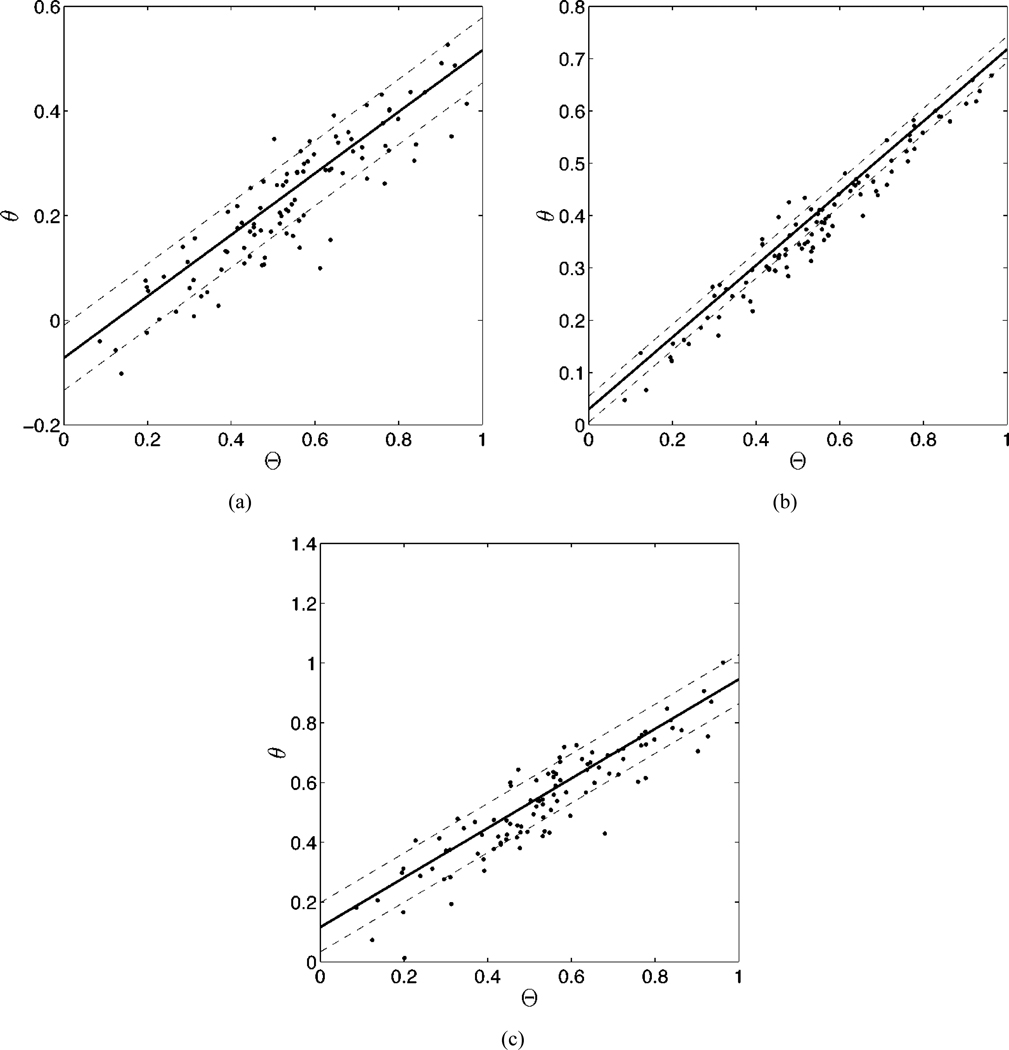
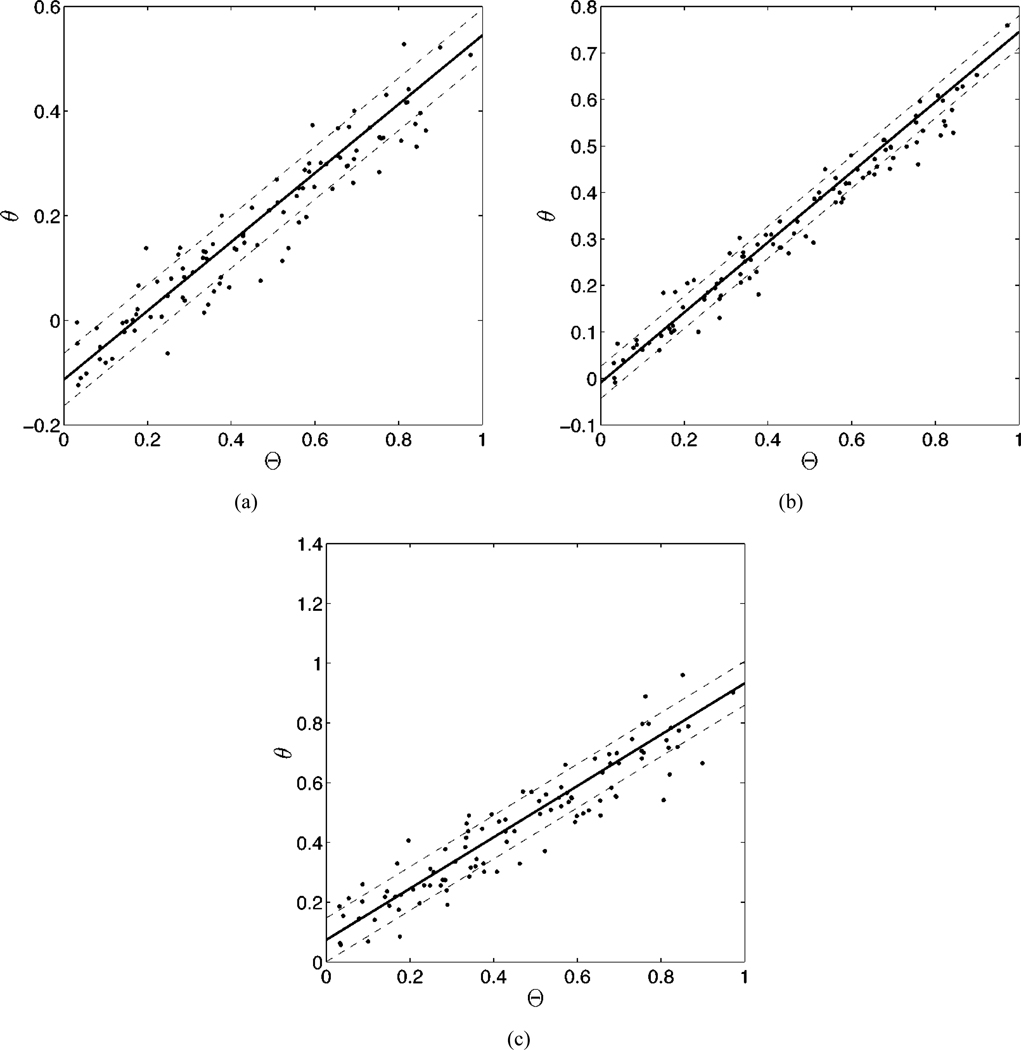
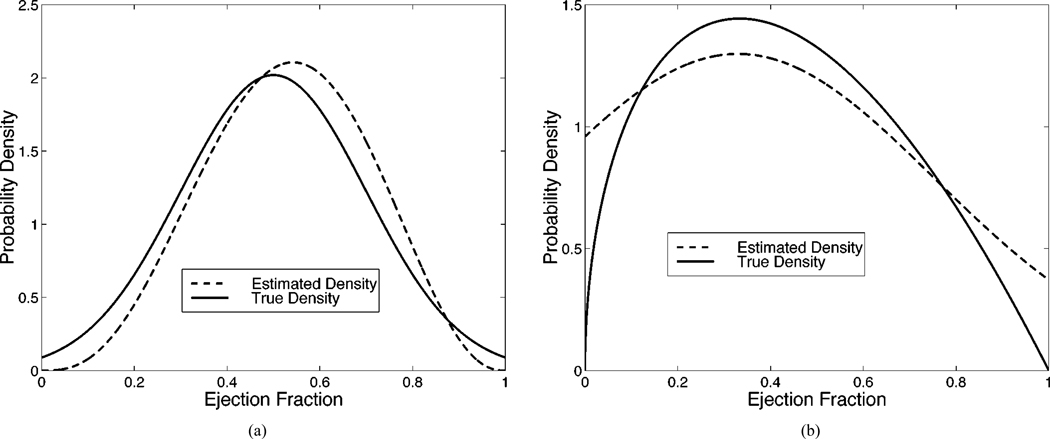
Imaging is often used for the purpose of estimating the value of some parameter of interest. For example, a cardiologist may measure the ejection fraction (EF) of the heart in order to know how much blood is being pumped out of the heart on each stroke. In clinical practice, however, it is difficult to evaluate an estimation method because the gold standard is not known, e.g., a cardiologist does not know the true EF of a patient. Thus, researchers have often evaluated an estimation method by plotting its results against the results of another (more accepted) estimation method, which amounts to using one set of estimates as the pseudogold standard. In this paper, we present a maximum-likelihood approach for evaluating and comparing different estimation methods without the use of a gold standard with specific emphasis on the problem of evaluating EF estimation methods. Results of numerous simulation studies will be presented and indicate that the method can precisely and accurately estimate the parameters of a regression line without a gold standard, i.e., without the x axis.
Figures
Similar articles
-
Evaluating Estimation Techniques in Medical Imaging Without a Gold Standard: Experimental Validation.Proc SPIE Int Soc Opt Eng. 2003 Feb 15;5034:10.1117/12.480330. doi: 10.1117/12.480330. Proc SPIE Int Soc Opt Eng. 2003. PMID: 26346933 Free PMC article.
-
Estimation in medical imaging without a gold standard.Acad Radiol. 2002 Mar;9(3):290-7. doi: 10.1016/s1076-6332(03)80372-0. Acad Radiol. 2002. PMID: 11887945 Free PMC article.
-
Comparing cardiac ejection fraction estimation algorithms without a gold standard.Acad Radiol. 2006 Mar;13(3):329-37. doi: 10.1016/j.acra.2005.12.005. Acad Radiol. 2006. PMID: 16488845 Free PMC article.
-
Folic acid supplementation and malaria susceptibility and severity among people taking antifolate antimalarial drugs in endemic areas.Cochrane Database Syst Rev. 2022 Feb 1;2(2022):CD014217. doi: 10.1002/14651858.CD014217. Cochrane Database Syst Rev. 2022. PMID: 36321557 Free PMC article.
-
European Association of Cardiovascular Imaging/Cardiovascular Imaging Department of the Brazilian Society of Cardiology recommendations for the use of cardiac imaging to assess and follow patients after heart transplantation.Eur Heart J Cardiovasc Imaging. 2015 Sep;16(9):919-48. doi: 10.1093/ehjci/jev139. Epub 2015 Jul 2. Eur Heart J Cardiovasc Imaging. 2015. PMID: 26139361 Review.
Cited by
-
Nuclear Medicine and Artificial Intelligence: Best Practices for Evaluation (the RELAINCE Guidelines).J Nucl Med. 2022 Sep;63(9):1288-1299. doi: 10.2967/jnumed.121.263239. Epub 2022 May 26. J Nucl Med. 2022. PMID: 35618476 Free PMC article.
-
Brain extraction in pediatric ADC maps, toward characterizing neuro-development in multi-platform and multi-institution clinical images.Neuroimage. 2015 Nov 15;122:246-61. doi: 10.1016/j.neuroimage.2015.08.002. Epub 2015 Aug 7. Neuroimage. 2015. PMID: 26260429 Free PMC article.
-
Need for objective task-based evaluation of AI-based segmentation methods for quantitative PET.Proc SPIE Int Soc Opt Eng. 2023 Feb;12467:124670R. doi: 10.1117/12.2647894. Epub 2023 Apr 3. Proc SPIE Int Soc Opt Eng. 2023. PMID: 37990707 Free PMC article.
-
Objective evaluation of reconstruction methods for quantitative SPECT imaging in the absence of ground truth.Proc SPIE Int Soc Opt Eng. 2015 Apr 13;9416:94161K. doi: 10.1117/12.2081286. Proc SPIE Int Soc Opt Eng. 2015. PMID: 26430292 Free PMC article.
-
Task-based evaluation of segmentation algorithms for diffusion-weighted MRI without using a gold standard.Phys Med Biol. 2012 Jul 7;57(13):4425-46. doi: 10.1088/0031-9155/57/13/4425. Epub 2012 Jun 20. Phys Med Biol. 2012. PMID: 22713231 Free PMC article.
References
-
- Barrett HH. Objective assessment of image quality: Effects of quantum noise and object variability. J. Opt. Soc. Amer. A. 1990;vol. 7(no. 7):1266–1278. - PubMed
-
- Barrett HH, Denny JL, Wagner RF, Myers KJ. Objective assessment of image quality. II. Fisher information, Fourier crosstalk and figures of merit for task performance. J. Opt. Soc. Amer. A. 1995;vol. 12(no. 5):834–852. - PubMed
-
- Barrett HH, Abbey CK, Clarkson E. Objective assessment of image quality: III. ROC metrics, ideal observers and likelihood-generating functions. J. Opt. Soc. Amer. A. 1998;vol. 15(no. 6):1520–1535. - PubMed
-
- Achtert A, King MA, Dahlberg ST, Pretorius PH, LaCroix KH, Tsui BMW. An investigation of the estimation of ejection fractions and cardiac volumes by a quantitative gated spect software package in simulated spect images. J. Nucl. Cardiol. 1998 Mar-Aug;vol. 5:144–152. - PubMed
-
- Vanhove C, Franken PR. Left ventricular ejection fraction and volumes from gated blood pool tomography: Comparison between two automatic algorithms that work in three-dimensional space. J. Nucl. Cardiol. 2001 Jul-Aug;vol. 8:466–471. - PubMed
