. 2002 Jul;76(14):7060-72.
doi: 10.1128/jvi.76.14.7060-7072.2002.

Processing map and essential cleavage sites of the nonstructural polyprotein encoded by ORF1 of the feline calicivirus genome

Affiliations

Processing map and essential cleavage sites of the nonstructural polyprotein encoded by ORF1 of the feline calicivirus genome

Stanislav V Sosnovtsev et al. J Virol. 2002 Jul.

Abstract

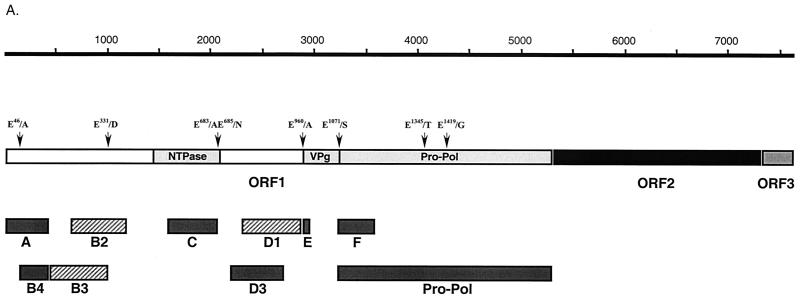
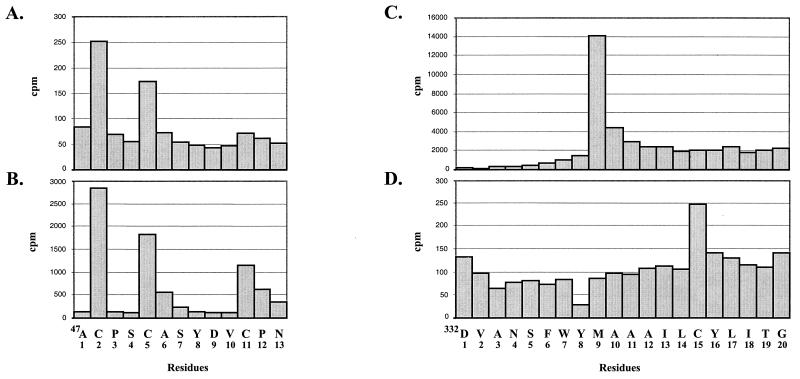
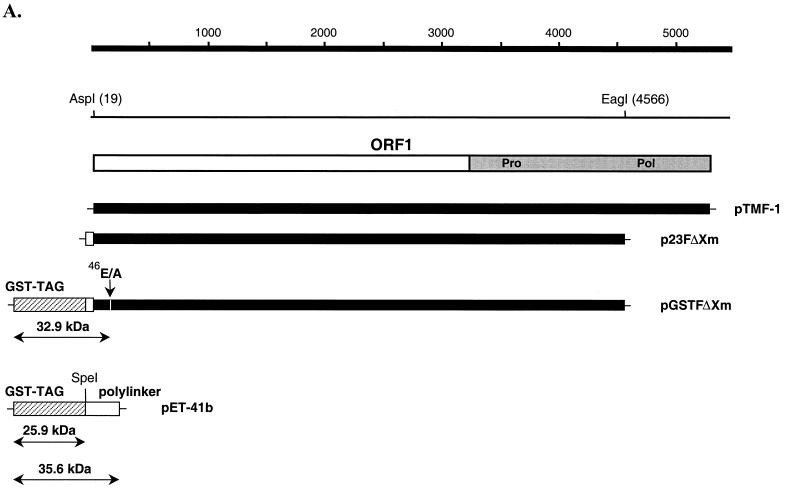
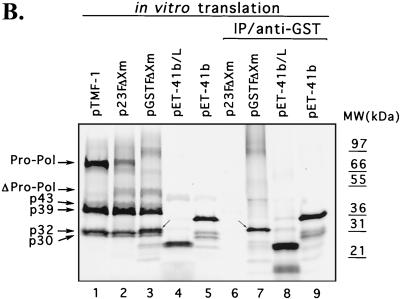
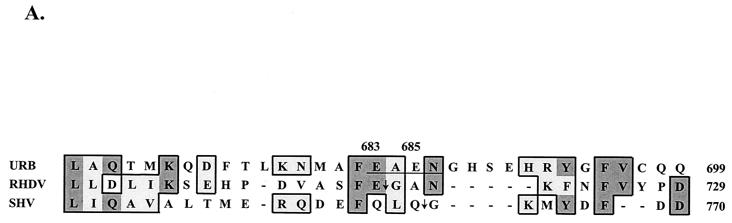
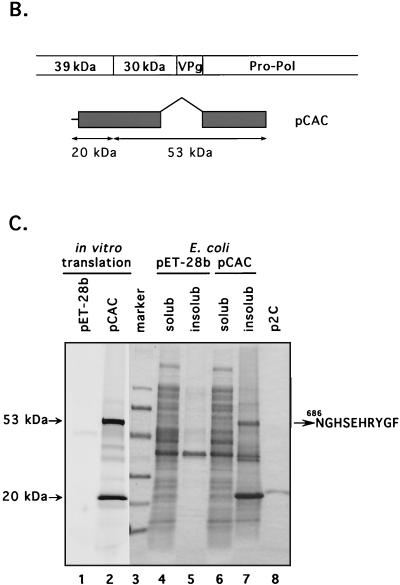
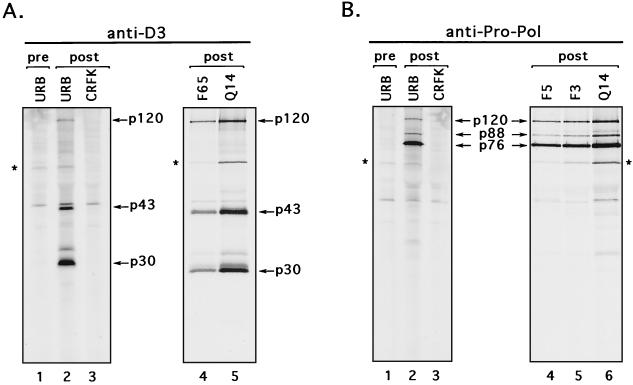
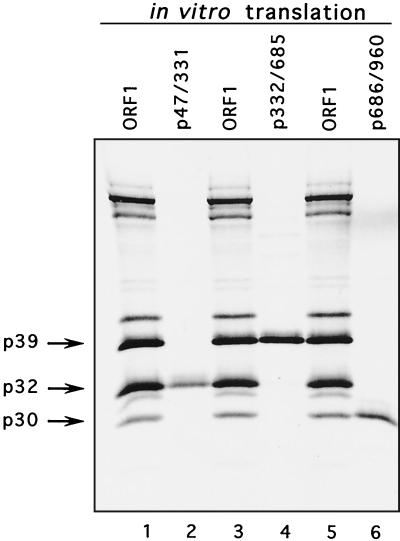
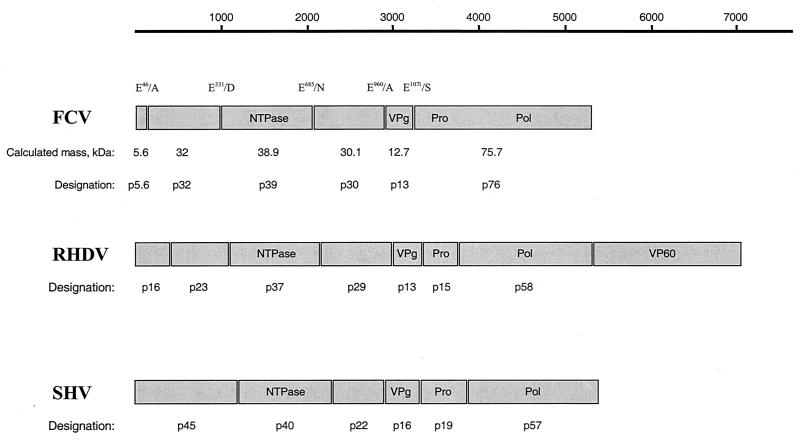
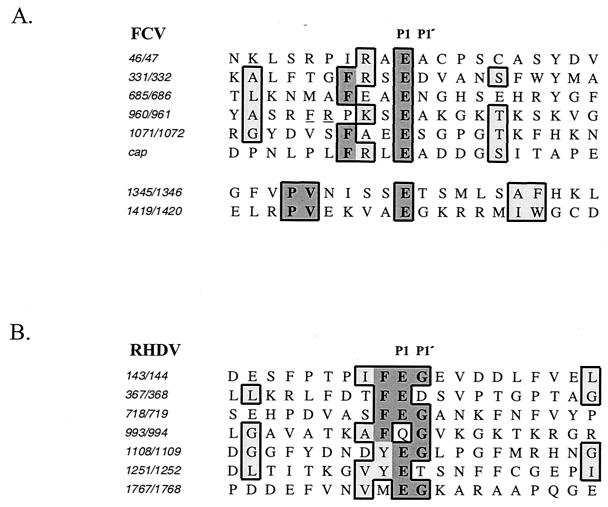
Feline calicivirus (FCV) nonstructural proteins are translated as part of a large polyprotein that undergoes autocatalytic processing by the virus-encoded 3C-like proteinase. In this study, we mapped three new cleavage sites (E(46)/A(47), E(331)/D(332), and E(685)/N(686)) recognized by the virus proteinase in the N-terminal part of the open reading frame 1 (ORF1) polyprotein to complete the processing map. Taken together with two sites we identified previously (E(960)/A(961) and E(1071)/S(1072)), the FCV ORF1 polyprotein contains five cleavage sites that define the borders of six proteins with calculated molecular masses of 5.6, 32, 38.9, 30.1, 12.7, and 75.7 kDa, which we designated p5.6, p32, p39 (NTPase), p30, p13 (VPg), and p76 (Pro-Pol), respectively. Mutagenesis of the E to A in each of these cleavage sites in an infectious FCV cDNA clone was lethal for the virus, indicating that these cleavages are essential in a productive virus infection. Mutagenesis of two cleavage sites (E(1345)/T(1346) and E(1419)/G(1420)) within the 75.7-kDa Pro-Pol protein previously mapped in bacterial expression studies was not lethal.


Figures

FIG. 1.
FIG. 1.
Localization and expression of FCV polyprotein fragments in E. coli. (A) Schematic diagram showing the organization of the FCV genome and location of cDNA fragments expressed in E. coli. The FCV ORF1 proteins, VPg and Pro-Pol, as well as the domain with amino acid homology to the picornavirus NTPase (nt 1445 to 2101) described by Neill (23) and the RHDV NTPase (19) are indicated as light gray boxes. The dipeptide cleavage sites previously identified (38) and the putative cleavage sites analyzed in the present study are indicated. The cDNA fragments efficiently expressed in E. coli are depicted as dark gray bars. The cDNA fragments corresponding to the B2, B3, and D1 regions that were found to be toxic for bacterial cells are shown as hatched gray bars. Bar E represents the peptide sequence corresponding to the beginning of the putative VPg. (B) Fusion proteins corresponding to regions A, B4, C, D3, and F were purified with Ni-NTA agarose. Aliquots were analyzed by SDS-PAGE followed by Coomassie blue staining. The expression levels of B2, B3, and D1 sequences were minimal. MW, molecular mass. (C) Immunoprecipitation of proteins obtained in coupled TNT reaction from pTMF1 (ORF1) with antisera raised against purified recombinant B4, C, D3, and F proteins. The radiolabeled in vitro translation products derived from pTMF1 (lane 1) were precipitated with either pre- or postimmunization sera raised against B4 protein (lanes 2 and 3), C protein (lanes 4 and 5), D3 protein (lanes 6 and 7), and F protein (lanes 8 and 9), subjected to SDS-PAGE, and visualized by autoradiography. (D) The same panel of antisera was analyzed for specificity by immunoprecipitation of radiolabeled proteins produced in FCV- or mock-infected CRFK cells. The CRFK cells were infected at an MOI of 1 to 4 with the FCV URB strain or mock infected. At 3.5 h postinfection, cells were metabolically labeled with [35S]methionine for 1 h. The radiolabeled proteins were immunoprecipitated from cell lysates, subjected to SDS-PAGE, and visualized by autoradiography. Radiolabeled proteins from FCV-infected CRFK cells that underwent immunoprecipitation with either pre- or postimmunization sera are shown as follows: lanes 1 and 2, anti-B4 sera; lanes 4 and 5, anti-C sera; lanes 7 and 8, anti-D3 sera; lanes 10 and 11, anti-F sera; and lanes 13 and 14, anti-FCV sera. As a control for cellular proteins that could be precipitated with the postimmunization sera, radiolabeled proteins precipitated from mock-infected CRFK cells with corresponding postimmunization sera are included as follows: lane 3, anti-B4 serum; lane 6, anti-C serum; lane 9, anti-D3 serum; lane 12, anti-F serum; and lane 15, anti-FCV serum.
FIG. 1.
FIG. 1.
Localization and expression of FCV polyprotein fragments in E. coli. (A) Schematic diagram showing the organization of the FCV genome and location of cDNA fragments expressed in E. coli. The FCV ORF1 proteins, VPg and Pro-Pol, as well as the domain with amino acid homology to the picornavirus NTPase (nt 1445 to 2101) described by Neill (23) and the RHDV NTPase (19) are indicated as light gray boxes. The dipeptide cleavage sites previously identified (38) and the putative cleavage sites analyzed in the present study are indicated. The cDNA fragments efficiently expressed in E. coli are depicted as dark gray bars. The cDNA fragments corresponding to the B2, B3, and D1 regions that were found to be toxic for bacterial cells are shown as hatched gray bars. Bar E represents the peptide sequence corresponding to the beginning of the putative VPg. (B) Fusion proteins corresponding to regions A, B4, C, D3, and F were purified with Ni-NTA agarose. Aliquots were analyzed by SDS-PAGE followed by Coomassie blue staining. The expression levels of B2, B3, and D1 sequences were minimal. MW, molecular mass. (C) Immunoprecipitation of proteins obtained in coupled TNT reaction from pTMF1 (ORF1) with antisera raised against purified recombinant B4, C, D3, and F proteins. The radiolabeled in vitro translation products derived from pTMF1 (lane 1) were precipitated with either pre- or postimmunization sera raised against B4 protein (lanes 2 and 3), C protein (lanes 4 and 5), D3 protein (lanes 6 and 7), and F protein (lanes 8 and 9), subjected to SDS-PAGE, and visualized by autoradiography. (D) The same panel of antisera was analyzed for specificity by immunoprecipitation of radiolabeled proteins produced in FCV- or mock-infected CRFK cells. The CRFK cells were infected at an MOI of 1 to 4 with the FCV URB strain or mock infected. At 3.5 h postinfection, cells were metabolically labeled with [35S]methionine for 1 h. The radiolabeled proteins were immunoprecipitated from cell lysates, subjected to SDS-PAGE, and visualized by autoradiography. Radiolabeled proteins from FCV-infected CRFK cells that underwent immunoprecipitation with either pre- or postimmunization sera are shown as follows: lanes 1 and 2, anti-B4 sera; lanes 4 and 5, anti-C sera; lanes 7 and 8, anti-D3 sera; lanes 10 and 11, anti-F sera; and lanes 13 and 14, anti-FCV sera. As a control for cellular proteins that could be precipitated with the postimmunization sera, radiolabeled proteins precipitated from mock-infected CRFK cells with corresponding postimmunization sera are included as follows: lane 3, anti-B4 serum; lane 6, anti-C serum; lane 9, anti-D3 serum; lane 12, anti-F serum; and lane 15, anti-FCV serum.
FIG. 2.
FIG. 2.
Comparative immunoprecipitation analysis of virus-specific proteins derived from ORF1. Shown are the results of SDS-PAGE analysis of the radiolabeled FCV ORF1 polyprotein cleavage products that were immunoprecipitated from FCV-infected cells (c) with ORF1 region-specific antisera (lanes 1, 3, 5, 7, and 9) or ORF1 in vitro translation mixture (t) (lanes 2, 4, 6, 8, and 10). Lane 11, radiolabeled TNT products derived from the ORF1 clone (pTMF-1).
FIG. 3.
FIG. 3.
Direct mapping of p32 and p39. Coupled transcription and translation of pTMF-1 were performed in the TNT system in the presence of [35S]cysteine. p32 was electrotransferred onto a polyvinylidene difluoride membrane following SDS-PAGE and subjected to microsequencing. The released radioactivity was determined for each cycle and is plotted against the residue number (A). To perform microsequence analysis of p32 synthesized in FCV-infected cells, the cells were labeled with [35S]cysteine, lysates were prepared, and radiolabeled protein was immunoprecipitated with anti-B4 serum. p32 was isolated and subjected to microsequence analysis as described above (B). For direct mapping of p39 protein, the coupled transcription and translation of pTMF-1 were performed in the presence of [35S]methionine or [35S]cysteine. Following gel separation, electrotransfer onto a polyvinylidene difluoride membrane, and microsequencing, the released radioactivity was determined for each cycle. Sequencing profiles for [35S]methionine and [35S]cysteine-labeled p39 are shown in panels C and D, respectively.
FIG. 4.
FIG. 4.
Detection of the N-terminal cleavage product of the ORF1 polyprotein fused to a GST-TAG sequence. (A) Localization of clones pTMF-1 (ORF1 clone), p23FΔXm, pGSTFΔXm, on the FCV ORF1 map. Plasmids were engineered as described in Materials and Methods. The GST-TAG sequence in pGSTFΔXm is shown as hatched gray bar. The polylinker sequence originating from plasmid pET-23a (Novagen), which was used to construct plasmid p23FΔXm, is indicated by an open bar. (B) SDS-PAGE analysis of the products obtained in TNT reactions and immunoprecipitation (IP) analysis with the GST-specific antibodies. Radiolabeled TNT translation products derived from the indicated plasmid are shown as follows: lane 1, pTMF-1; lane 2, p23FΔXm; lane 3, pGSTFΔXm; lane 4, pET-41b linearized (L) with SpeI; lane 5, pET-41b. The radiolabeled in vitro translation products derived from p23FΔXm, pGSTFΔXm, pET-41b linearized with SpeI, and pET-41b were subjected to immunoprecipitation analysis with anti-GST antibodies (Sigma) and analyzed on the same gel: lane 6, p23FΔXm; lane 7, pGSTFΔXm; lane 8, pET-41b linearized with SpeI; and lane 9, pET-41b. Small arrows indicate the protein band that corresponds to the GST-TAG-polylinker-p5.6 fusion protein. MW, molecular mass.
FIG. 4.
FIG. 4.
Detection of the N-terminal cleavage product of the ORF1 polyprotein fused to a GST-TAG sequence. (A) Localization of clones pTMF-1 (ORF1 clone), p23FΔXm, pGSTFΔXm, on the FCV ORF1 map. Plasmids were engineered as described in Materials and Methods. The GST-TAG sequence in pGSTFΔXm is shown as hatched gray bar. The polylinker sequence originating from plasmid pET-23a (Novagen), which was used to construct plasmid p23FΔXm, is indicated by an open bar. (B) SDS-PAGE analysis of the products obtained in TNT reactions and immunoprecipitation (IP) analysis with the GST-specific antibodies. Radiolabeled TNT translation products derived from the indicated plasmid are shown as follows: lane 1, pTMF-1; lane 2, p23FΔXm; lane 3, pGSTFΔXm; lane 4, pET-41b linearized (L) with SpeI; lane 5, pET-41b. The radiolabeled in vitro translation products derived from p23FΔXm, pGSTFΔXm, pET-41b linearized with SpeI, and pET-41b were subjected to immunoprecipitation analysis with anti-GST antibodies (Sigma) and analyzed on the same gel: lane 6, p23FΔXm; lane 7, pGSTFΔXm; lane 8, pET-41b linearized with SpeI; and lane 9, pET-41b. Small arrows indicate the protein band that corresponds to the GST-TAG-polylinker-p5.6 fusion protein. MW, molecular mass.
FIG. 5.
FIG. 5.
Analysis of the cleavage site between p39 and p30. (A) An alignment of the deduced amino acid sequences of the putative junction of the FCV p39 and p30 with the corresponding regions of RHDV (GenBank accession no. M67473) and SHV (GenBank accession no. L07418) was created with the Multalin computer program (5) with the following parameters: gap weight, 5.0; gap length weight, 0. The numbers given next to the protein sequences correspond to numbering systems for the virus polyproteins. Identical and similar amino acids of calicivirus sequences are shaded in dark and light tones, respectively. The sequence of the putative N-terminal cleavage site of the FCV p39 is underlined. Arrows are used to indicate the corresponding cleavage sites in sequences of the RHDV and SHV polyproteins. (B) Schematic representation of the pCAC plasmid, which was engineered to contain the p39-p30 junction and an active 3C-like proteinase. The entire VPg sequence and C-terminus sequence of p30 were deleted. (C) SDS-PAGE analysis of proteins encoded in pCAC when expressed in vitro and in E. coli. Lanes: 1 and 2, in vitro TNT translation products derived from pET-28b (vector) and pCAC, respectively (autoradiography); 3, electrophoresis calibration kit protein markers (Pharmacia) corresponding to molecular masses of 94, 67, 43, 30, 20, and 14 kDa (from top to bottom of gel); 4 and 5, soluble (solub) and insoluble (insolub) fractions of induced bacterial cells transformed with pET-28b, respectively; 6 and 7, soluble and insoluble fractions of induced bacterial cells transformed with pCAC; 8, purified 21.6-kDa recombinant protein encoded by plasmid p2C. Proteins in lanes 3 to 8 were detected by Coomassie blue staining. Arrows point to the two major pCAC proteins expressed in both in vitro translation reactions and in bacteria. The N-terminal sequence of the 53-kDa protein (NGHSEHRYGF) is shown.
FIG. 5.
FIG. 5.
Analysis of the cleavage site between p39 and p30. (A) An alignment of the deduced amino acid sequences of the putative junction of the FCV p39 and p30 with the corresponding regions of RHDV (GenBank accession no. M67473) and SHV (GenBank accession no. L07418) was created with the Multalin computer program (5) with the following parameters: gap weight, 5.0; gap length weight, 0. The numbers given next to the protein sequences correspond to numbering systems for the virus polyproteins. Identical and similar amino acids of calicivirus sequences are shaded in dark and light tones, respectively. The sequence of the putative N-terminal cleavage site of the FCV p39 is underlined. Arrows are used to indicate the corresponding cleavage sites in sequences of the RHDV and SHV polyproteins. (B) Schematic representation of the pCAC plasmid, which was engineered to contain the p39-p30 junction and an active 3C-like proteinase. The entire VPg sequence and C-terminus sequence of p30 were deleted. (C) SDS-PAGE analysis of proteins encoded in pCAC when expressed in vitro and in E. coli. Lanes: 1 and 2, in vitro TNT translation products derived from pET-28b (vector) and pCAC, respectively (autoradiography); 3, electrophoresis calibration kit protein markers (Pharmacia) corresponding to molecular masses of 94, 67, 43, 30, 20, and 14 kDa (from top to bottom of gel); 4 and 5, soluble (solub) and insoluble (insolub) fractions of induced bacterial cells transformed with pET-28b, respectively; 6 and 7, soluble and insoluble fractions of induced bacterial cells transformed with pCAC; 8, purified 21.6-kDa recombinant protein encoded by plasmid p2C. Proteins in lanes 3 to 8 were detected by Coomassie blue staining. Arrows point to the two major pCAC proteins expressed in both in vitro translation reactions and in bacteria. The N-terminal sequence of the 53-kDa protein (NGHSEHRYGF) is shown.
FIG. 6.
FIG. 6.
Comparative analysis of virus polyprotein processing products in CRFK cells infected with cleavage site mutants. The CRFK cells were infected at an MOI of 1 to 4 with FCV URB or with viruses recovered from plasmids pQ14 (Q14), pF65 (F65), pF3 (F3), and pF5 (F5). A mock-infected CRFK control was included. At 3.5 h postinfection, cells were metabolically labeled with [35S]methionine for 1 h. (A) The radiolabeled proteins were immunoprecipitated from cell lysates with anti-D3 (specific for p30) sera (lane 1, preimmunization serum; lanes 2, 3, 4, and 5, postimmunization serum). (B) The radiolabeled proteins were also immunoprecipitated from cell lysates with anti-Pro-Pol sera (lane 1, preimmunization serum; lanes 2, 3, 4, 5, and 6, postimmunization serum). Asterisks denote a 60-kDa protein coprecipitated from virus-infected cells.
FIG. 7.
FIG. 7.
Comparison of p39, p32, and p30 synthesized in vitro with products produced by cleavage of the FCV ORF1 polyprotein synthesized in vitro. Lanes: 1, 3, and 5, radiolabeled TNT products derived from ORF1 clone (pTMF-1); 2, 4, and 6, radiolabeled TNT products produced by in vitro translation of cDNA clones encoding the fragments of the FCV ORF1 corresponding to aa 47 to 331, 332 to 685, and 686 to 960, respectively.
FIG. 8.
FIG. 8.
Comparison of the genetic map of FCV ORF1 with those of other caliciviruses, SHV and RHDV. A schematic representation of proteins encoded by ORF1 of the FCV, RHDV, and SHV genomes is shown. Protein coding sequences are drawn as boxes, with the molecular mass of the encoded protein shown above. The locations and designations of the proteins encoded by RHDV and SHV ORF1 are adapted from studies by Meyers et al. (22) and Liu et al. (18).
FIG. 9.
FIG. 9.
Comparison of cleavage sites identified in the polyproteins encoded by ORF1 of FCV and RHDV. (A) Alignment of the amino acid sequences flanking the cleavage sites of the FCV ORF1 polyprotein and the sequence of the FCV capsid precursor cleavage site. An alignment of sequences adjacent to the internal cleavage sites of the 75.7-kDa protein (Pro-Pol) is shown separately. Identical and similar amino acids are shaded in dark and light tones, respectively. The arginine and phenylalanine residues at positions −5 and −6 of the E960/A961 cleavage site are underlined. (B) Alignment of the amino acid sequences flanking cleavage sites of the RHDV ORF1 polyprotein. Studies by Meyers et al. provided the RHDV sequence (21) and cleavage site (22) data.

Similar articles

Cited by

References

    1. Aldabe, R., A. Barco, and L. Carrasco. 1996. Membrane permeabilization by poliovirus proteins 2B and 2BC. J. Biol. Chem. 271:23134-23137. - PubMed
    1. Carter, M. J. 1989. Feline calicivirus protein synthesis investigated by Western blotting. Arch. Virol. 108:69-79. - PMC - PubMed
    1. Carter, M. J., I. D. Milton, P. C. Turner, J. Meanger, M. Bennett, and R. M. Gaskell. 1992. Identification and sequence determination of the capsid protein gene of feline calicivirus. Arch. Virol. 122:223-235. - PMC - PubMed
    1. Cho, M. W., N. Teterina, D. Egger, K. Bienz, and E. Ehrenfeld. 1994. Membrane rearrangement and vesicle induction by recombinant poliovirus 2C and 2BC in human cells. Virology 202:129-145. - PubMed
    1. Corpet, F. 1988. Multiple sequence alignment with hierarchical clustering. Nucleic Acids Res. 16:10881-10890. - PMC - PubMed

MeSH terms