

Immune control of the number and reactivation phenotype of cells latently infected with a gammaherpesvirus
- PMID: 12072512
- PMCID: PMC136321
- DOI: 10.1128/jvi.76.14.7125-7132.2002
Immune control of the number and reactivation phenotype of cells latently infected with a gammaherpesvirus
Abstract
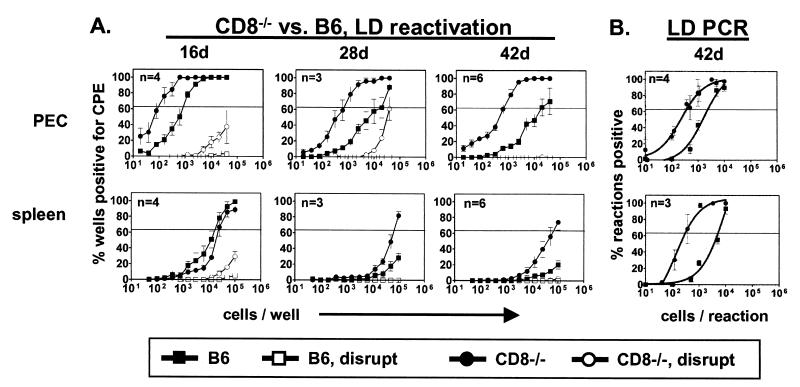
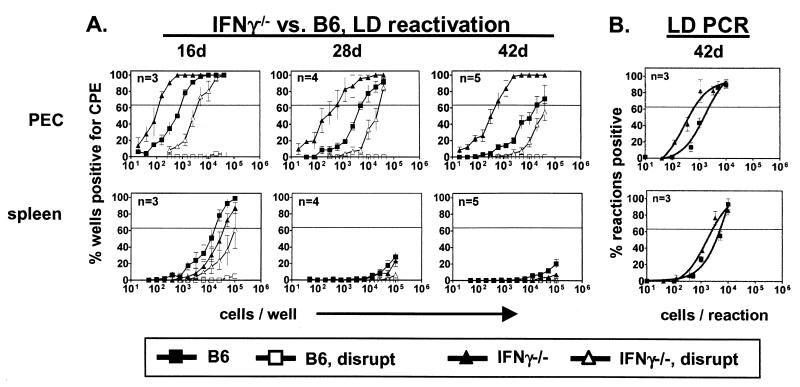
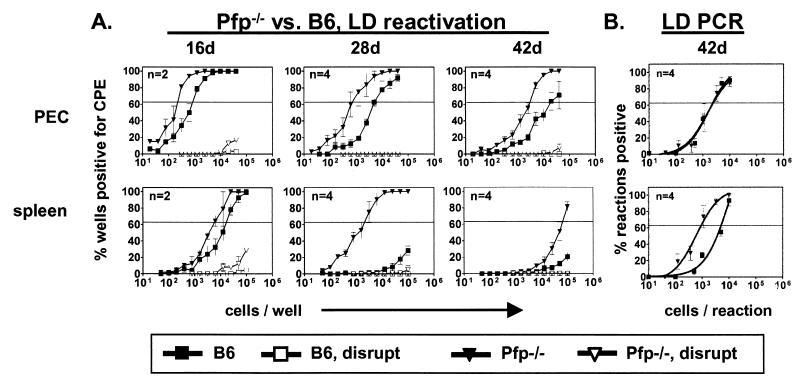
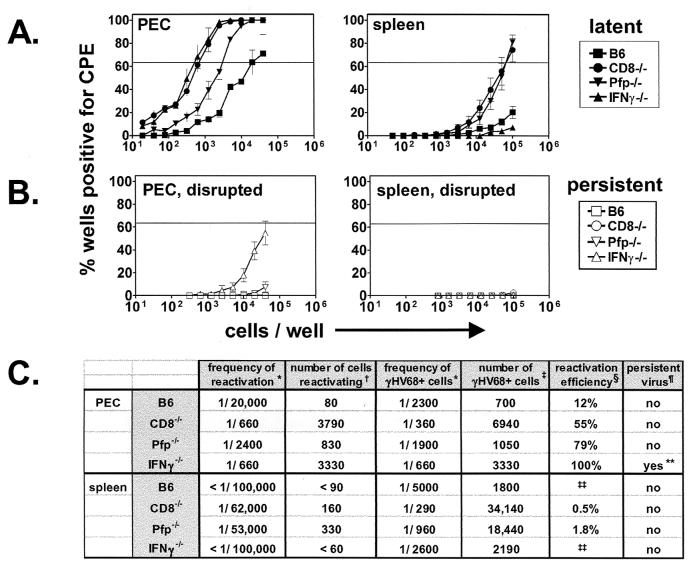
Despite active immune responses, gammaherpesviruses establish latency. In a related process, these viruses also persistently replicate by using a mechanism that requires different viral genes than acute-phase replication. Many questions remain about the role of immunity in chronic gammaherpesvirus infection, including whether the immune system controls latency by regulating latent cell numbers and/or other properties and what specific immune mediators control latency and persistent replication. We show here that CD8(+) T cells regulate both latency and persistent replication and demonstrate for the first time that CD8(+) T cells regulate both the number of latently infected cells and the efficiency with which infected cells reactivate from latency. Furthermore, we show that gamma interferon (IFN-gamma) and perforin, which play no significant role during acute infection, are essential for immune control of latency and persistent replication. Surprisingly, the effects of perforin and IFN-gamma are site specific, with IFN-gamma being important in peritoneal cells while perforin is important in the spleen. Studies of the mechanisms of action of IFN-gamma and perforin revealed that perforin acts primarily by controlling the number of latently infected cells while IFN-gamma acts primarily by controlling reactivation efficiency. The immune system therefore controls chronic gammaherpesvirus infection by site-specific mechanisms that regulate both the number and reactivation phenotype of latently infected cells.
Figures
Similar articles
-
Gamma interferon blocks gammaherpesvirus reactivation from latency in a cell type-specific manner.J Virol. 2007 Jun;81(11):6134-40. doi: 10.1128/JVI.00108-07. Epub 2007 Mar 14. J Virol. 2007. PMID: 17360749 Free PMC article. Review.
-
LXR Alpha Restricts Gammaherpesvirus Reactivation from Latently Infected Peritoneal Cells.J Virol. 2019 Mar 5;93(6):e02071-18. doi: 10.1128/JVI.02071-18. Print 2019 Mar 15. J Virol. 2019. PMID: 30602604 Free PMC article.
-
Perforin and Fas in murine gammaherpesvirus-specific CD8(+) T cell control and morbidity.J Gen Virol. 2001 Aug;82(Pt 8):1971-1981. doi: 10.1099/0022-1317-82-8-1971. J Gen Virol. 2001. PMID: 11458005
-
Immunological control of murine gammaherpesvirus infection is independent of perforin.J Gen Virol. 1997 Aug;78 ( Pt 8):2025-30. doi: 10.1099/0022-1317-78-8-2025. J Gen Virol. 1997. PMID: 9267003
-
Natural history of murine gamma-herpesvirus infection.Philos Trans R Soc Lond B Biol Sci. 2001 Apr 29;356(1408):569-79. doi: 10.1098/rstb.2000.0779. Philos Trans R Soc Lond B Biol Sci. 2001. PMID: 11313012 Free PMC article. Review.
Cited by
-
Enhanced response of T cells from murine gammaherpesvirus 68-infected mice lacking the suppressor of T cell receptor signaling molecules Sts-1 and Sts-2.PLoS One. 2014 Feb 28;9(2):e90196. doi: 10.1371/journal.pone.0090196. eCollection 2014. PLoS One. 2014. PMID: 24587276 Free PMC article.
-
Defining immune engagement thresholds for in vivo control of virus-driven lymphoproliferation.PLoS Pathog. 2014 Jun 26;10(6):e1004220. doi: 10.1371/journal.ppat.1004220. eCollection 2014 Jun. PLoS Pathog. 2014. PMID: 24967892 Free PMC article.
-
CD4 and CD8 T cells directly recognize murine gammaherpesvirus 68-immortalized cells and prevent tumor outgrowth.J Virol. 2013 May;87(10):6051-4. doi: 10.1128/JVI.00375-13. Epub 2013 Mar 20. J Virol. 2013. PMID: 23514885 Free PMC article.
-
Control of virus reactivation arrests pulmonary herpesvirus-induced fibrosis in IFN-gamma receptor-deficient mice.Am J Respir Crit Care Med. 2007 Jun 1;175(11):1139-50. doi: 10.1164/rccm.200610-1426OC. Epub 2007 Mar 15. Am J Respir Crit Care Med. 2007. PMID: 17363768 Free PMC article.
-
The gammaherpesvirus 68 viral cyclin facilitates expression of LANA.PLoS Pathog. 2021 Nov 15;17(11):e1010019. doi: 10.1371/journal.ppat.1010019. eCollection 2021 Nov. PLoS Pathog. 2021. PMID: 34780571 Free PMC article.
References
-
- Babcock, G. J., D. Hochberg, and D. A. Thorley-Lawson. 2000. The expression pattern of Epstein-Barr virus latent genes in vivo is dependent upon the differentiation stage of the infected B cell. Immunity 13:497-506. - PubMed
-
- Badovinac, V. P., A. R. Tvinnereim, and J. T. Harty. 2000. Regulation of antigen-specific CD8+ T cell homeostasis by perforin and interferon-gamma. Science 290:1354-1358. - PubMed
Publication types
MeSH terms
Substances
Grants and funding
- R01 CA058524/CA/NCI NIH HHS/United States
- R01 HL060090/HL/NHLBI NIH HHS/United States
- AI39616/AI/NIAID NIH HHS/United States
- R01 CA043143/CA/NCI NIH HHS/United States
- R01 CA052004/CA/NCI NIH HHS/United States
- T32 CA009547/CA/NCI NIH HHS/United States
- CA74730/CA/NCI NIH HHS/United States
- 5 T32 AI07163/AI/NIAID NIH HHS/United States
- HL60090/HL/NHLBI NIH HHS/United States
- T32 AI007163/AI/NIAID NIH HHS/United States
- CA52004/CA/NCI NIH HHS/United States
- CA43143/CA/NCI NIH HHS/United States
- R01 CA074730/CA/NCI NIH HHS/United States
- CA58524/CA/NCI NIH HHS/United States
- 5 T32 CA09547-14/CA/NCI NIH HHS/United States
LinkOut - more resources
Full Text Sources
Research Materials
