. 2002 Jun 25;99(13):8784-9.
doi: 10.1073/pnas.132047099. Epub 2002 Jun 18.

Polynucleotide phosphorylase is a global regulator of virulence and persistency in Salmonella enterica

Affiliations

Polynucleotide phosphorylase is a global regulator of virulence and persistency in Salmonella enterica

Mark O Clements et al. Proc Natl Acad Sci U S A. .

Abstract

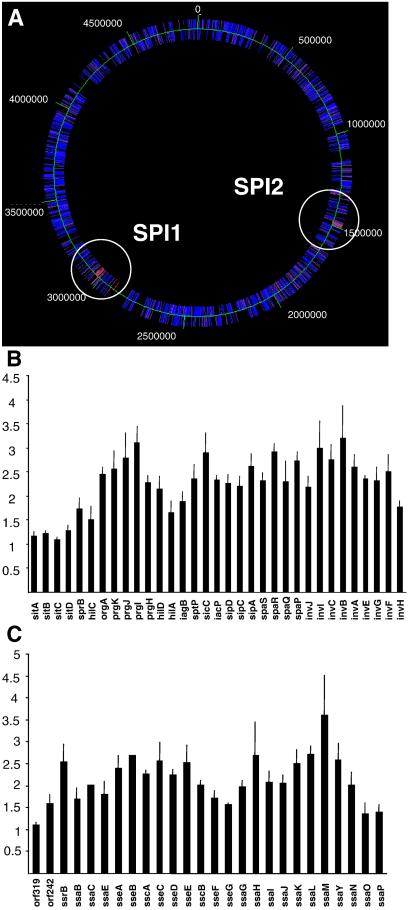
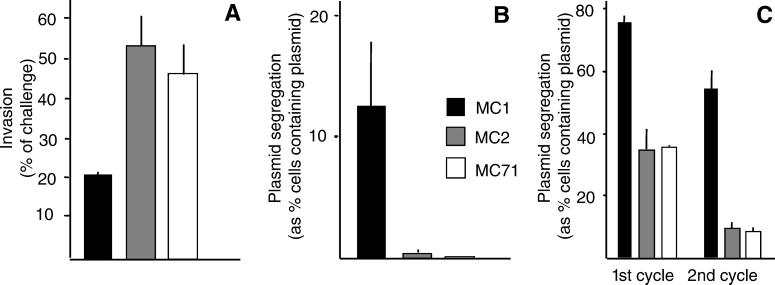
For many pathogens, the ability to regulate their replication in host cells is a key element in establishing persistency. Here, we identified a single point mutation in the gene for polynucleotide phosphorylase (PNPase) as a factor affecting bacterial invasion and intracellular replication, and which determines the alternation between acute or persistent infection in a mouse model for Salmonella enterica infection. In parallel, with microarray analysis, PNPase was found to affect the mRNA levels of a subset of virulence genes, in particular those contained in Salmonella pathogenicity islands 1 and 2. The results demonstrate a connection between PNPase and Salmonella virulence and show that alterations in PNPase activity could represent a strategy for the establishment of persistency.


Figures

Figure 1
Figure 1
PNPase of S. typhimurium MC2 is truncated and lacks exonuclease activity. (A) Immunoblot analysis with rabbit antibodies directed against E. coli PNPase (29) was performed on whole-cell lysates of MC1 (lane 1), MC2 (lane 2), and MC71 (lane 3). The migration of marker proteins is indicated on the right with their molecular masses. (B) His-tagged fusion proteins of the whole and truncated form of S. typhimurium PNPase were overexpressed in E. coli (lanes 1 and 3, respectively), and the fusion proteins were purified (lanes 2 and 4). (C) Mean PNPase activities are shown. wt, wild type; trunc., truncated. Purified proteins were assayed for PNPase activity with a photometric assay for PNPase exonuclease activity.
Figure 2
Figure 2
The pnp mutation of MC2 increases the expression of 87 S. typhimurium genes. (A) Color code presentation displaying relative amounts of mRNA originating from 3,169 separate ORFs positioned on the chromosome. Increasing mRNA levels in MC2 are shown on a scale from blue to red. Two clusters encoding increased mRNA are located in SPI 1 and SPI 2. (B and C) The actual increases for individual genes in MC2 are shown, where 1 represents a 1:1 ratio of MC2 to MC1 transcripts. The error bars indicate the standard error of the mean.
Figure 3
Figure 3
Effect of PNPase on the stability of the sipC transcript. (A) Expression of the sipC transcript was followed by Northern blot analysis during growth of MC1 and MC2 in LB at 37°C. Samples were taken after 2, 3, 4, 5, 7, and 11 h. (B) A PhosphorImage quantification of the sipC band intensities is shown. Quantification of sipC (C) or ompA (D) mRNA also was performed on samples taken at intervals after the addition of rifampicin (200 μg/ml). Band intensities of the transcripts were quantified and normalized to the amount of 16S rRNA. The signal strength at time 0 was set as 100%. (C and D) The percentage of remaining transcript at the different times after addition of rifampicin is shown.
Figure 4
Figure 4
S. typhimurium MC2 and MC71 have enhanced invasion and intracellular growth capability. (A) Invasion of MDCK cells was performed as described (20). Replication in the spleens of BALB/c (B) or macrophage-like cell line J744-A.1 (C) was followed by comparing the segregation rates of plasmid pHSG412 or pPir as a measure of bacterial cell division.
Figure 5
Figure 5
SDS/PAGE profiles of proteins secreted from S. typhimurium. Lane 1 shows the profile of a MC1 hilA mutant; lane 2 shows wild-type MC1 stained with Coomassie blue. Proteins identified from lane 2 by N-terminal sequencing are indicated between lanes 1 and 2. H1 and H2 show the flagellin proteins of S. typhimurium. Lanes 3–5 show the autoradiograms, respectively, of proteins metabolically labeled and secreted from invasive cultures of MC1, MC2, and MC71. Labeling was performed in the presence of rifampicin (200 μg/ml). The positions of molecular mass markers are indicated between lanes 2 and 3.

References

    1. Hansen-Wester I, Hensel M. Microb Infect. 2000;3:549–559. - PubMed
    1. Pang T, Bhutta Z A, Finlay B B, Altwegg M. Trends Microbiol. 1995;3:253–255. - PubMed
    1. Buchwald D S, Blaser M J. Rev Infect Dis. 1984;6:345–356. - PubMed
    1. Edelman R, Levine M. Rev Infect Dis. 1986;8:329–349. - PubMed
    1. Carter P B, Collins F M. J Exp Med. 1974;139:1189–1203. - PMC - PubMed

Publication types

MeSH terms

Associated data