. 2002 May-Jun;9(3):138-50.
doi: 10.1101/lm.46502.

The time course of neural changes underlying auditory perceptual learning

Affiliations

The time course of neural changes underlying auditory perceptual learning

Mercedes Atienza et al. Learn Mem. 2002 May-Jun.

Abstract

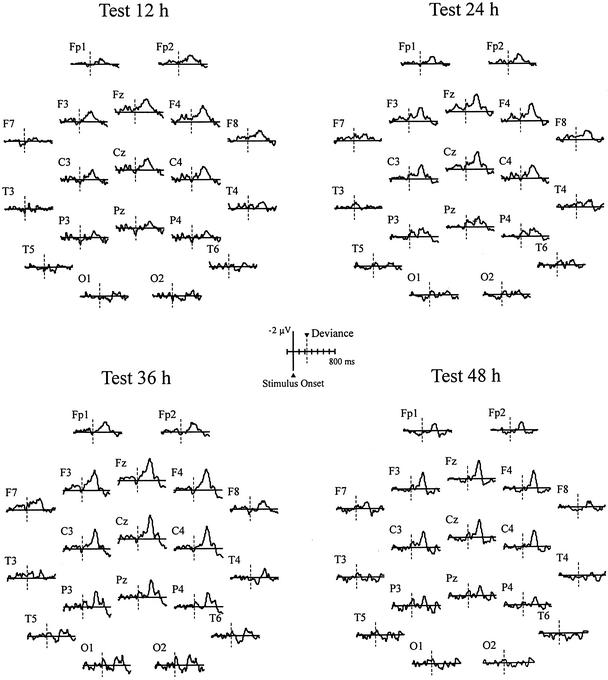
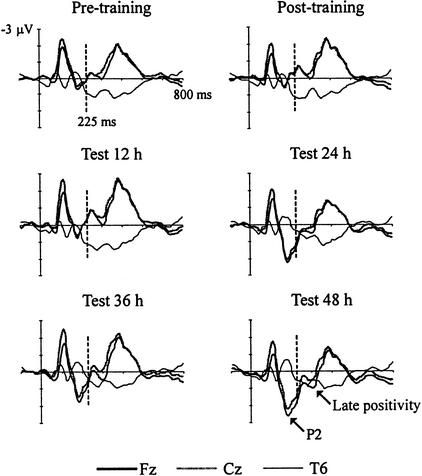
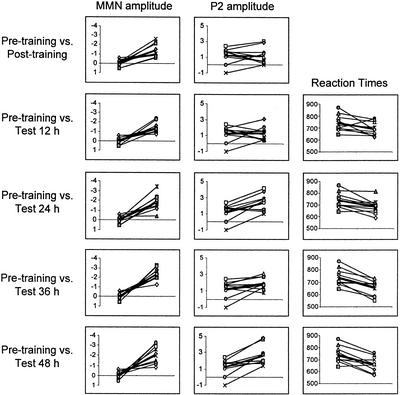
Improvement in perception takes place within the training session and from one session to the next. The present study aims at determining the time course of perceptual learning as revealed by changes in auditory event-related potentials (ERPs) reflecting preattentive processes. Subjects were trained to discriminate two complex auditory patterns in a single session. ERPs were recorded just before and after training, while subjects read a book and ignored stimulation. ERPs showed a negative wave called mismatch negativity (MMN)-which indexes automatic detection of a change in a homogeneous auditory sequence-just after subjects learned to consciously discriminate the two patterns. ERPs were recorded again 12, 24, 36, and 48 h later, just before testing performance on the discrimination task. Additional behavioral and neurophysiological changes were found several hours after the training session: an enhanced P2 at 24 h followed by shorter reaction times, and an enhanced MMN at 36 h. These results indicate that gains in performance on the discrimination of two complex auditory patterns are accompanied by different learning-dependent neurophysiological events evolving within different time frames, supporting the hypothesis that fast and slow neural changes underlie the acquisition of improved perception.


Figures

Figure 1
Figure 1
Stimulus and experimental design. A scheme of auditory patterns is shown on the top (left corner). The black bar on the sixth segment (signaled with a black arrow) denotes the frequency change introduced within the deviant pattern at 225 msec from stimulus onset. Event-related potentials (ERPs) were always recorded under no-attention conditions in different sessions. Training in the discrimination task took place in session 1, and performance was tested repeatedly over time after recording ERPs in the remaining sessions using a single block.
Figure 2
Figure 2
(Top) Mean hits and false alarms obtained for the first (b1, b2, b3) and last three blocks (b4, b5, b6) of the training phase. (Bottom) Mean Pr discrimination index obtained in the first and last three blocks of the training phase. Pr was computed by subtracting the false alarm rate from the hit rate.
Figure 3
Figure 3
Mean Pr discrimination index (hit rate minus false alarm rate) and mean reaction times obtained at the end of the training phase and in the different tests (t1, t2, t3, t4). The training condition results from averaging data of the last two blocks in the training phase.
Figure 4
Figure 4
(Left and right) Superimposed grand-average event-related potentials (ERPs; n = 10) to standard (thin line) and deviant (thick line) stimuli at Fz and T6, respectively. (Middle) Grand-average difference waves at Fz and T6 obtained by subtracting ERPs to the standard tone from ERPs to the deviant tone.
Figure 5
Figure 5
Scalp topography of the grand-average difference waveforms (n = 10) obtained at all recording sites in the pre- and post-training conditions in session 1 by subtracting the event-related potentials elicited by the standard pattern from the event-related potentials elicited by the deviant pattern. The vertical line (dashed line) indicates the introduction of the frequency change within the deviant pattern.
Figure 6
Figure 6
Scalp topography of the grand-average difference waveforms (n = 10) obtained at all recording sites at 12, 24, 36, and 48 h after training by subtracting the event-related potentials elicited by the standard pattern from the event-related potentials elicited by the deviant pattern. The vertical line (dashed line) indicates the introduction of the frequency change within the deviant pattern.
Figure 7
Figure 7
Superimposed grand-average (n = 10) event-related potentials to standard patterns at Fz, Cz, and T6 for all experimental conditions. The early (P2) and late positive waves are indicated with two black arrows in the panel corresponding to the test at 48 h after training.
Figure 8
Figure 8
Training-induced changes. Superimposed individual (thin lines with different symbols) and group (thick line without symbol) data. Changes in mismatch negativity (MMN) and P2 amplitudes (left and middle columns) in all post-training phases compared with the pre-training phase. Reaction times in the different tests as compared with mean reaction times obtained in the last two blocks of the training session.

References

    1. Aaltonen O, Eerola O, Lang AH, Uusipaikka E, Tuomainen J. Automatic discrimination of phonetically relevant and irrelevant vowel parameters as reflected by mismatch negativity. J Acoust Soc Am. 1994;96:1489–1493. - PubMed
    1. Ahissar M, Hochstein S. The role of attention in early perceptual learning. Proc Natl Acad Sci. 1993;90:5718–5722. - PMC - PubMed
    1. ————— Learning pop-out detection: Specificities to stimulus characteristics. Vision Res. 1996;36:3487–3500. - PubMed
    1. ————— The spread of attention and learning in feature search: Effects of target distribution and task difficulty. Vision Res. 2000;40:1349–1364. - PubMed
    1. Amenedo H, Escera C. The accuracy of sound duration representation in the human brain determines the accuracy of behavioral perception. Eur J Neurosci. 2000;12:1570–1574. - PubMed

LinkOut - more resources