. 2002 Jun 15;22(12):4776-85.
doi: 10.1523/JNEUROSCI.22-12-04776.2002.

Increase in the pool size of releasable synaptic vesicles by the activation of protein kinase C in goldfish retinal bipolar cells

Affiliations

Increase in the pool size of releasable synaptic vesicles by the activation of protein kinase C in goldfish retinal bipolar cells

Ken Berglund et al. J Neurosci. .

Abstract

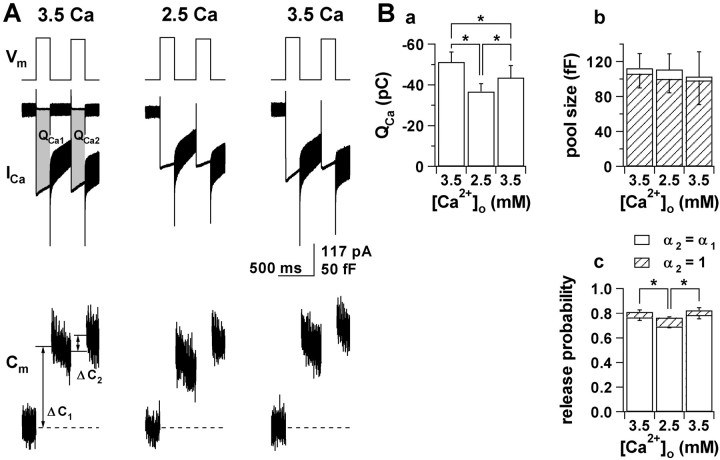
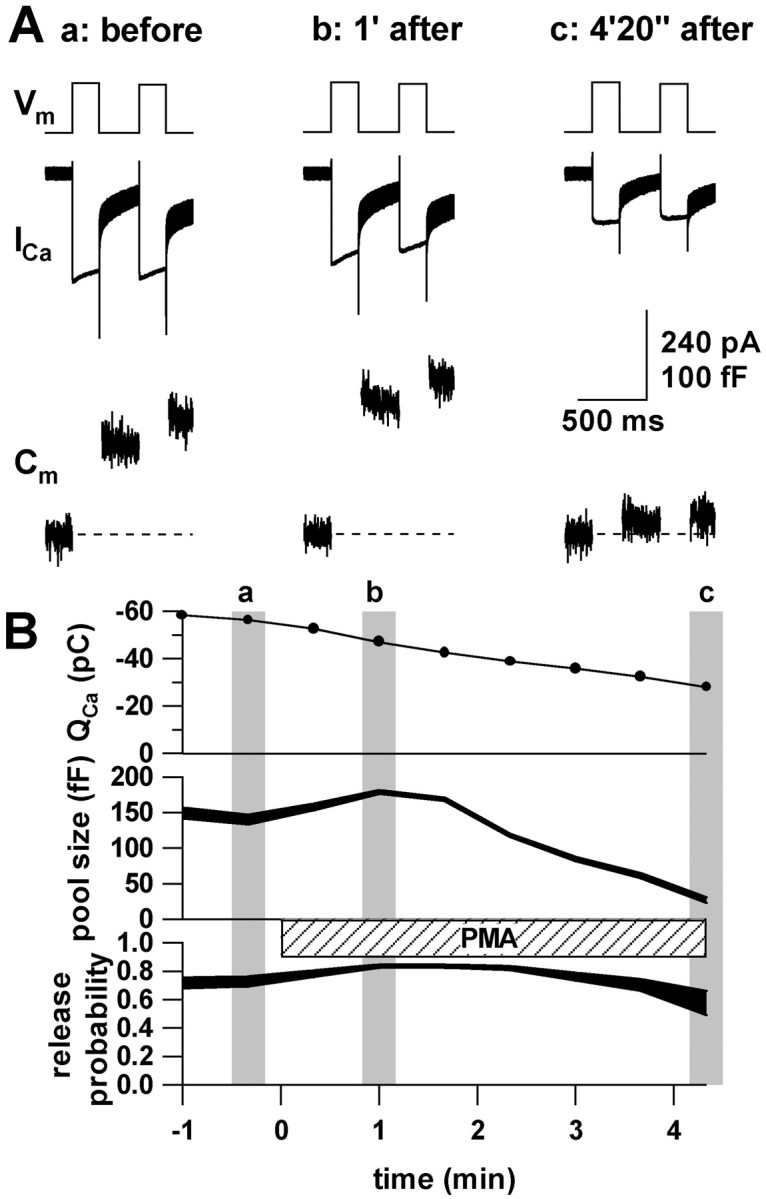
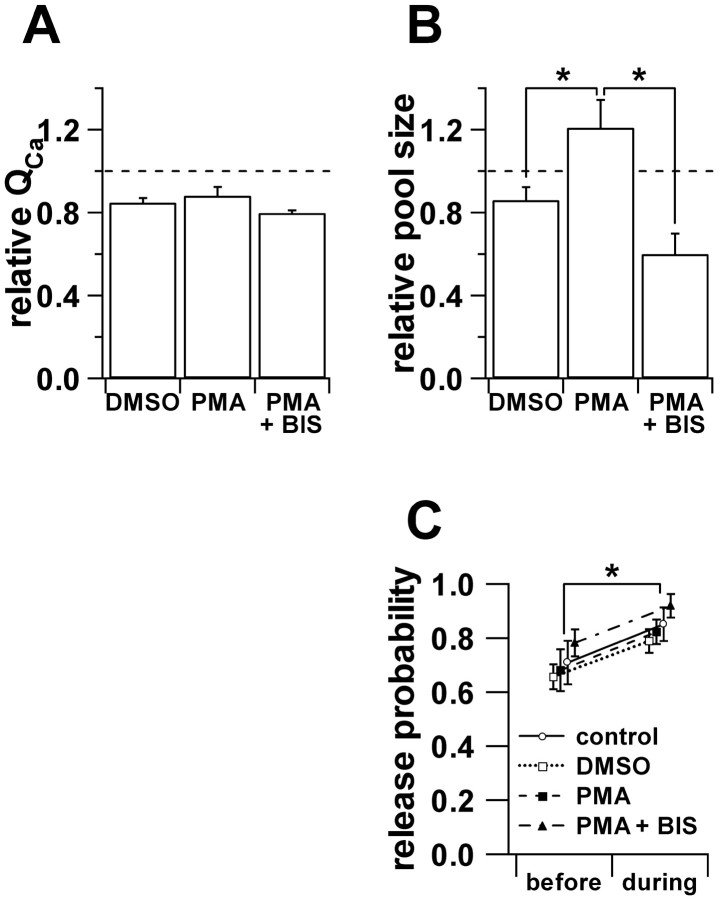
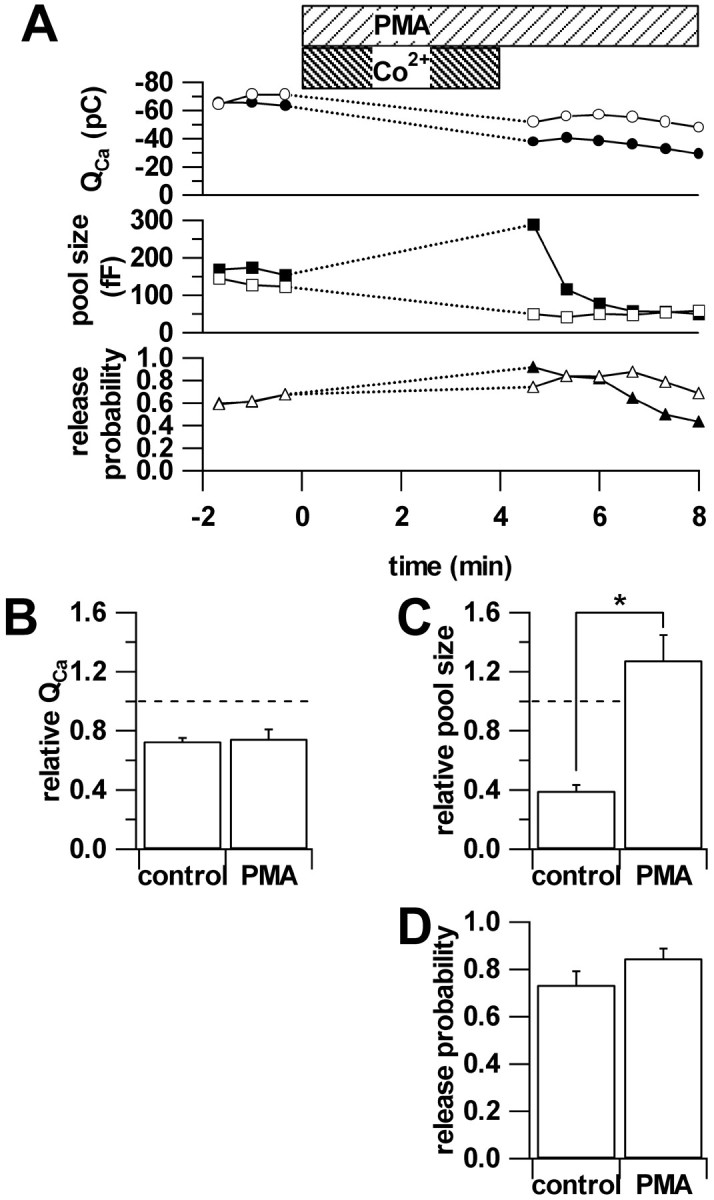
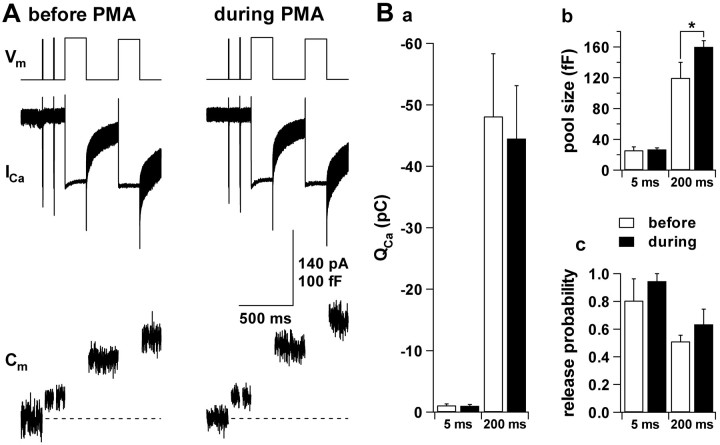
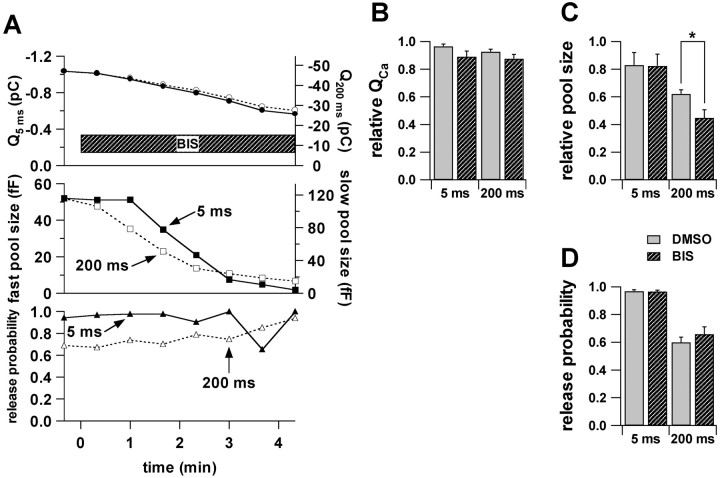
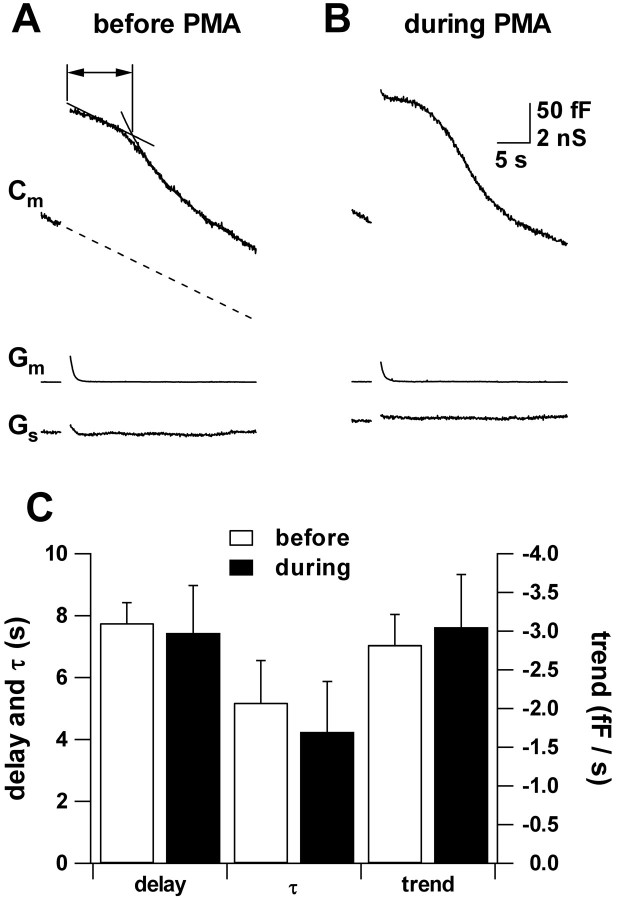
Secretion from neurons and neuroendocrine cells is enhanced by the activation of protein kinase C (PKC) in various preparations. We have already reported that transmitter (glutamate) release from Mb1 bipolar cells in the goldfish retina is potentiated by the activation of PKC. However, it is not yet settled whether the potentiation is ascribed to the increase in the pool size of releasable synaptic vesicles or in release probability. In the present study, Ca2+ influx and exocytosis were simultaneously monitored by measuring the presynaptic Ca2+ current and membrane capacitance changes, respectively, in a terminal detached from the bipolar cell. The double pulse protocol was used to estimate separately the changes in the pool size and release probability. The activation of PKC by phorbol 12-myristate 13-acetate (PMA) specifically increased the pool size but not the release probability. PKC was activated by PMA even after the Ca2+ influx was blocked by Co2+. In bipolar cells the releasable pool can be divided into two components: one is small and rapidly exhausted, and the other is large and slowly exocytosed. To identify which component is responsible for the increase in the pool size, the effects of PMA and a PKC-specific inhibitor, bisindolylmaleimide I (BIS), on each component were examined. The slow component was selectively increased by PMA and reduced by BIS. Thus, we conclude that the activation of PKC in Mb1 bipolar cells potentiates glutamate release by increasing the pool size of the slow component.


Figures

Fig. 1.
Fig. 1.
Estimation of the pool size and release probability by the double-pulse protocol. Changes in [Ca2+]o affected release probability but not the pool size. A, The double-pulse protocol. Two 200 msec pulses were applied with an interpulse interval of 300 msec to a terminal detached from the Mb1 bipolar cell. The intensity of the second pulse (to −2 mV) was adjusted to produce a similar Ca2+ current (ICa) evoked by the first pulse (to 0 mV). The thick parts inICa were evoked by a 1 kHz sine wave superimposed on the holding potential of −60 mV to calculate the membrane capacitance (Cm). In this figure the sine wave was omitted from the trace of the membrane potential (Vm) for clarity. The pool size and release probability were estimated based on two capacitance jumps (ΔC1 and ΔC2, see Materials and Methods).ICa was integrated to calculate the amount of Ca2+ influx during depolarization (QCa1 and QCa2; shadow regions in ICa) after subtraction of the leak current, which was obtained in the Co2+ solution (nearly flat trace inICa). The double pulses were repetitively applied every 40 sec in two different [Ca2+]o (3.5 and 2.5 mm). The illustrated data were obtained within 3 min after rupture of the patch membrane. B, Effects of [Ca2+]o onQCa (a), the pool size (b), and release probability (c). Data were obtained from four terminals.Open and shaded bars (b, c) are obtained on the assumption that the release probability after the first pulse remains constant (α2 = α1) and increases to 1, respectively (see Materials and Methods).Asterisks denote significant difference in the two-tailed, paired Student's t test (p < 0.05). Error bars in this and the subsequent figures denote SEM.
Fig. 2.
Fig. 2.
Effects of PMA on the pool size and release probability. A, ICa andCm before and during the application PMA (100 nm). Double pulses (Vm) were applied to a detached terminal repetitively at intervals of 40 sec. Each set ofVm,ICa, andCm was obtained before (a), 1 min after (b), and 4 min 20 sec after (c) the application of PMA.B, Time course of changes inQCa, the pool size and release probability before and during the application of PMA (horizontal bar). The thickness of lines in the graphs of the pool size and release probability depicts the range of maximums and minimums of estimation. Original traces shown inA were recorded at the corresponding periods (a–c, gray zones).
Fig. 3.
Fig. 3.
Evaluation of the specificity for PMA-induced changes. A, Changes in QCaafter the introduction of DMSO (1:10,000 v/v; n = 11), PMA (10 or 100 nm with DMSO; n = 5), or PMA plus BIS (500 nm with DMSO;n = 4). Relative values indicate the ratio ofQCa 1 min 40 sec after the application of each agent to QCa before its application.B, Changes in the pool size after the application of each agent. The pool size in this and the subsequent figures refers to the maximum of estimation. Relative values were calculated with the data obtained at the same timing as in A.Asterisks denote significant differences in the two-tailed Student's t test (p < 0.05). C, Changes in release probability after the application of each agent. Release probability in this and the subsequent figures refers to the minimum of estimation. In the control condition, no agent was added to the superfusate, and data were obtained at the corresponding time to the other conditions (n = 5). Significant difference (asterisk) was detected only in the main effect of time (before/after application), and neither in the main effect of agents nor in the interaction (the two-way ANOVA; four conditions × before/after application; p < 0.05).
Fig. 4.
Fig. 4.
Activation of PKC at the resting [Ca2+]i. A,QCa, the pool size, and release probability were estimated in the absence (open symbols) or in the presence (solid symbols) of PMA (100 nm). To suppress the Ca2+ influx into the terminals, double-pulse stimulation was interrupted in the presence of Co2+ for 5 min. The periods of PMA and Co2+ treatment are indicated by horizontal bars. The pool size of the PMA-treated terminal increased soon after the double pulse was resumed (solid squares). Bar graphs illustrate the relative values of QCa(B), of the pool size (C), and release probability (D). The relative values were the ratio of the values obtained 5 min after the application of the Co2+ solution to those before its application. The pool size was significantly increased by the PMA treatment (*p < 0.05, the two-tailed Student'st test; n = 5 in each condition).
Fig. 5.
Fig. 5.
Increase in the pool size of the slow component of exocytosis by PMA. A, Traces obtained before and during the application of PMA (100 nm). Two double pulses (5 msec × 2 and 200 msec × 2) were applied to a detached terminal to discriminate the PMA-induced effect on the two components of exocytosis (for details, see Results). B, Summary of the two double-pulse experiment (n = 3).QCa (a) and the pool size (b) are shown in absolute values to help comparison between two components of exocytosis. Openand solidbars correspond to the values obtained before and 1 min 40 sec after the application of PMA, respectively. An asterisk denotes a significant difference in the two-tailed, paired Student's t test (p < 0.05).
Fig. 6.
Fig. 6.
Decrease in the pool size of the slow component by BIS. A, Two double pulses (same as in Fig. 5) were repetitively applied to a detached terminal, and the effects of BIS (500 nm) on two components of exocytosis were examined separately. QCa (circles), the pool size (squares), and release probability (triangles) for each component are plotted against time after the BIS application (horizontal bar). The fast (solid symbols) and slow (open symbols) components of exocytosis were examined by 5 and 200 msec double pulses, respectively. The decrease in the pool size of the slow component (open squares) preceded that of the fast component (solid squares). B–D, Summary of the two double pulse experiment in the presence of DMSO (1:10,000 v/v;open bars, n = 5) and BIS (with DMSO, solid bars;n = 5). The relative values of QCa(B) and the pool size (C) are calculated as in Figure 3. Release probability is shown inD. Values obtained by three successive stimuli (1 min 40 sec, 2 min 20 sec, and 3 min after drug application) were averaged. Anasterisk denotes a significant difference in the two-tailed Student's t test (p < 0.05).
Fig. 7.
Fig. 7.
No effect of PMA on endocytosis. A,B, The membrane capacitance (Cm), the membrane conductance (Gm), and the series conductance (Gs) are calculated before (A) and 1 min after (B) the application of PMA (100 nm). Traces are illustrated on a slow time scale. Double pulse stimulation was applied during the gaps of traces in each panel. The values of Cmbefore stimulation were 3.78 pF (A) and 3.44 pF (B). The values of Gmand Gs before the application of PMA (A) were 0.164 and 38.8 nS, respectively. The transient jump in Gm after the pulse may be ascribed to the activation of the Ca2+-dependent Cl current (Okada et al., 1995) but did not affect the measurement of Cm. C, The trend (dotted line), the delay (line witharrowheads), and the time constant of the decay (τ) determined by fitting an exponential function (smooth curve) were calculated before (open bars) and during the application of PMA (solid bars), as described in Results. These three parameters of endocytosis were not significantly changed by the application of PMA (p > 0.1; the two-tailed, paired Student'st test; n = 5).

Similar articles

Cited by

References

    1. Asaoka Y, Nakamura S, Yoshida K, Nishizuka Y. Protein kinase C, calcium and phospholipid degradation. Trends Biochem Sci. 1992;17:414–417. - PubMed
    1. Betz A, Ashery U, Rickmann M, Augustin I, Neher E, Südhof TC, Rettig J, Brose N. Munc13–1 is a presynaptic phorbol ester receptor that enhances neurotransmitter release. Neuron. 1998;21:123–136. - PubMed
    1. Bowlby MR, Levitan IB. Block of cloned voltage-gated potassium channels by the second messenger diacylglycerol independent of protein kinase C. J Neurophysiol. 1995;73:2221–2229. - PubMed
    1. Brose N, Rosenmund C, Rettig J. Regulation of transmitter release by Unc-13 and its homologues. Curr Opin Neurobiol. 2000;10:303–311. - PubMed
    1. Castagna M, Takai Y, Kaibuchi K, Sano K, Kikkawa U, Nishizuka Y. Direct activation of calcium-activated, phospholipid-dependent protein kinase by tumor-promoting phorbol esters. J Biol Chem. 1982;257:7847–7851. - PubMed

Publication types

MeSH terms

LinkOut - more resources