. 2002 Jun 15;22(12):5081-90.
doi: 10.1523/JNEUROSCI.22-12-05081.2002.

Visual and anticipatory bias in three cortical eye fields of the monkey during an adaptive decision-making task

Affiliations

Visual and anticipatory bias in three cortical eye fields of the monkey during an adaptive decision-making task

Brian Coe et al. J Neurosci. .

Abstract

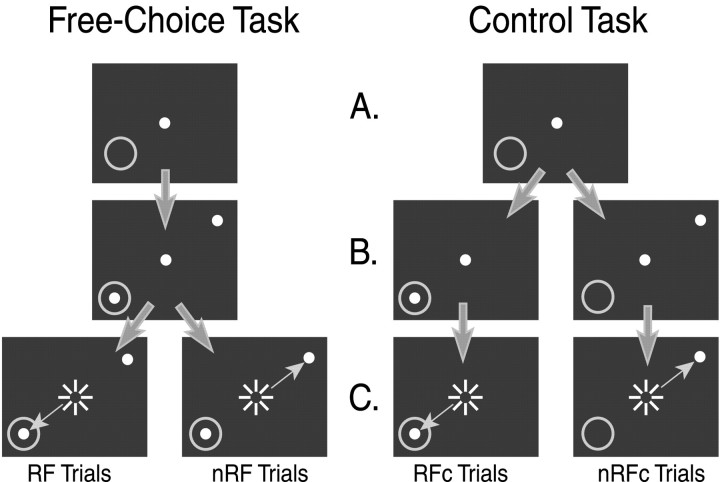
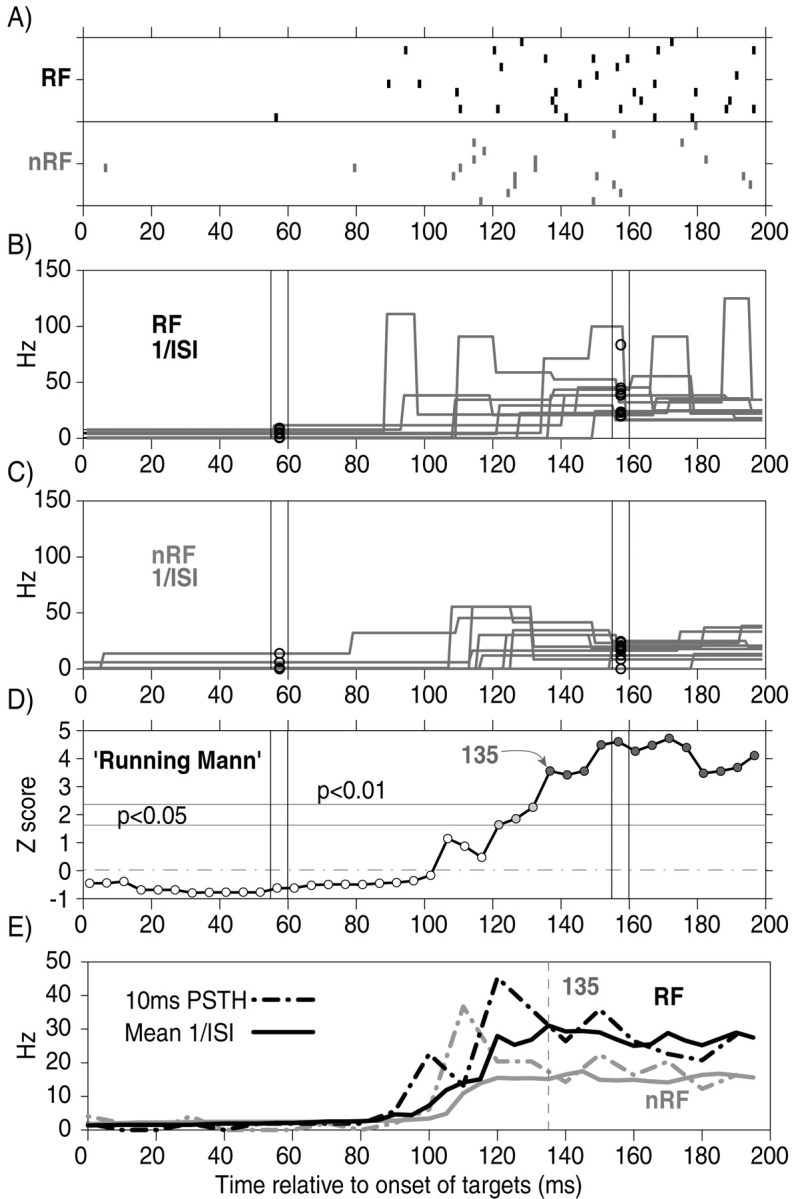
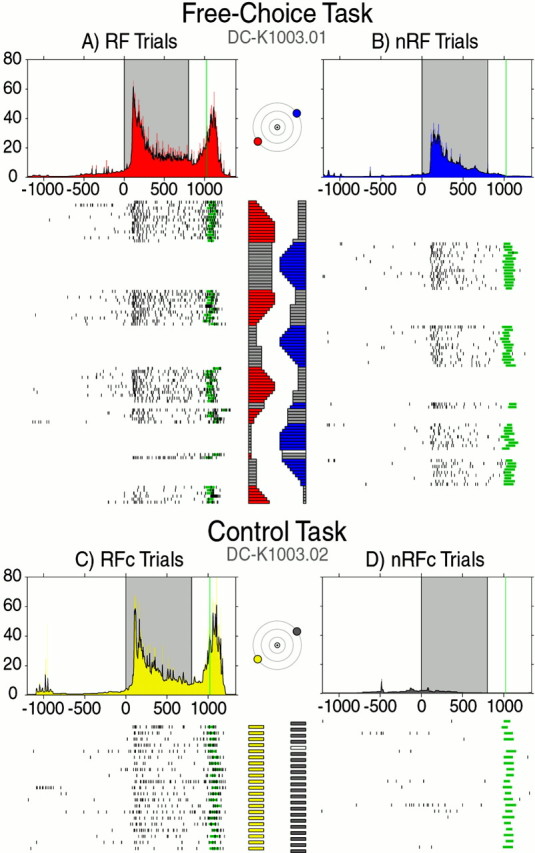
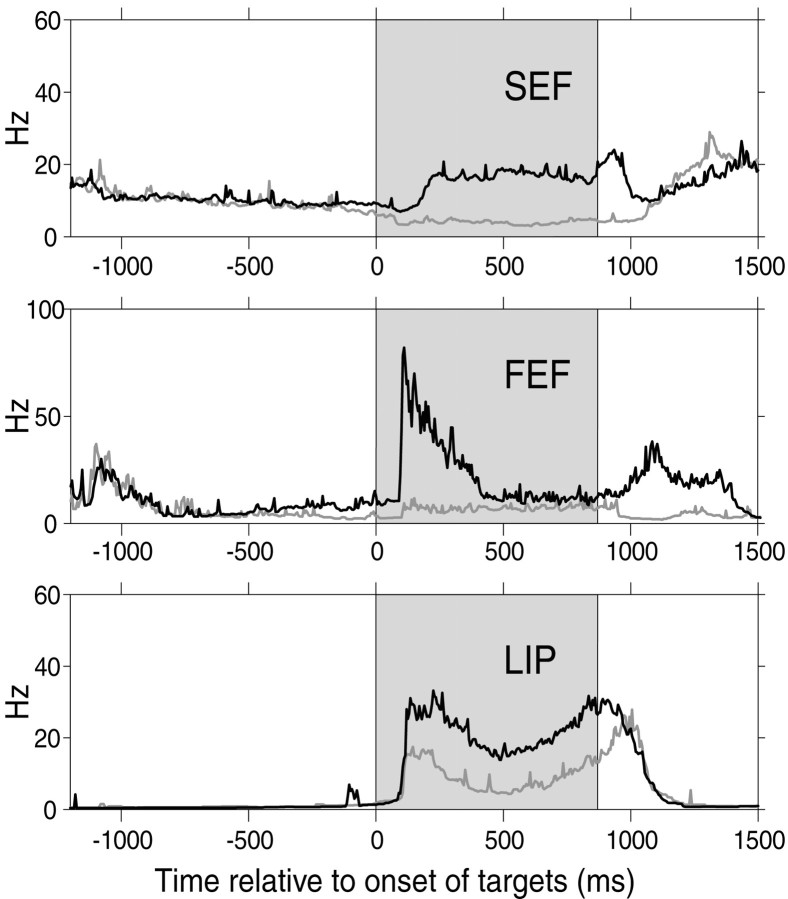
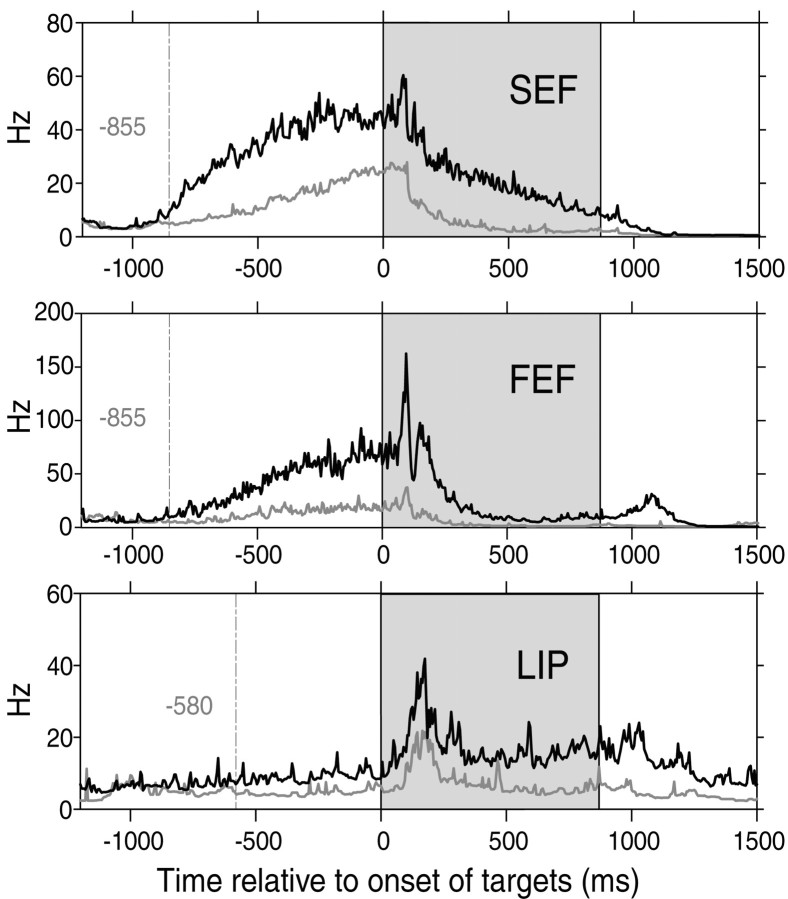
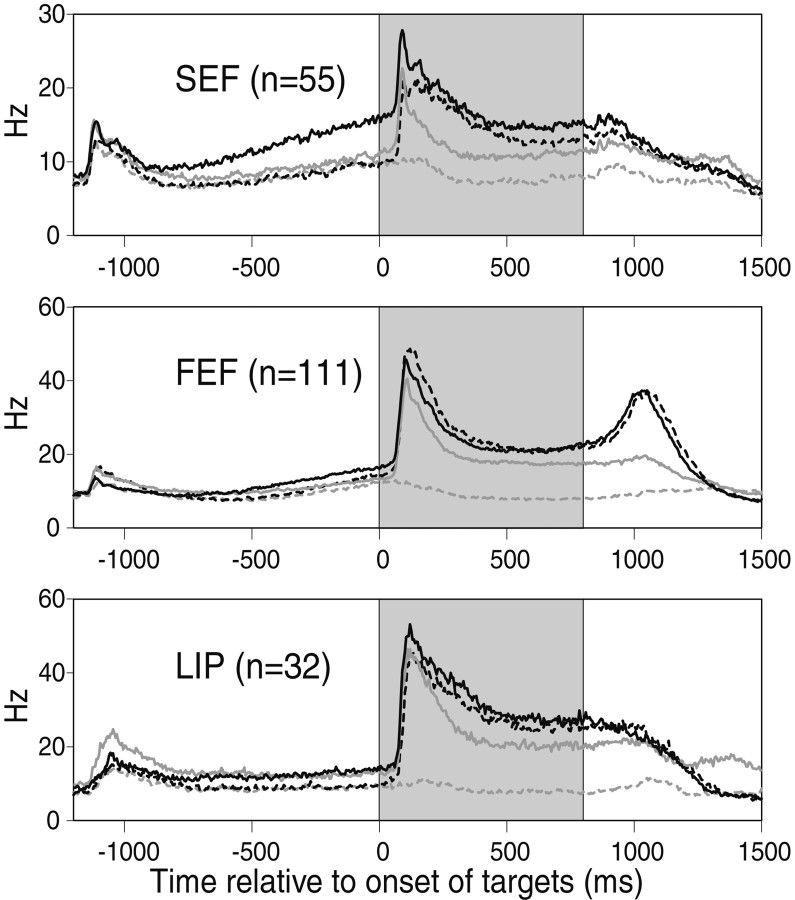
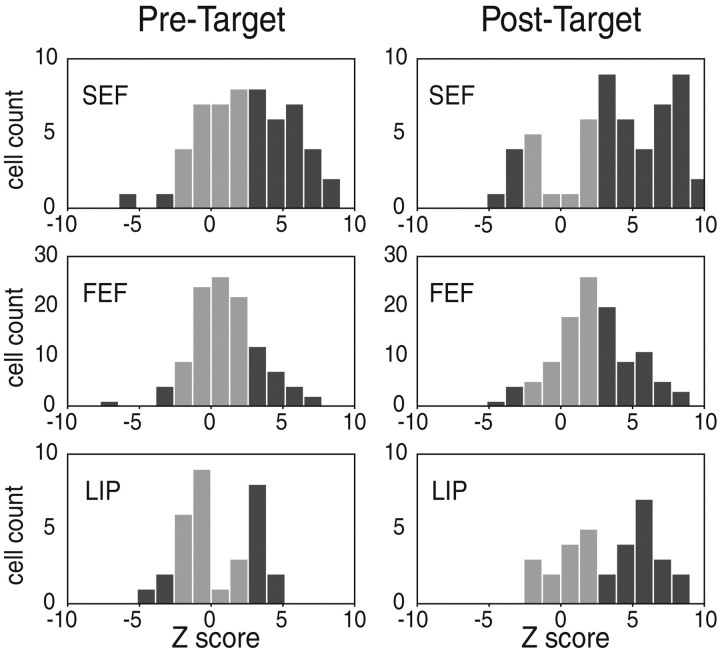
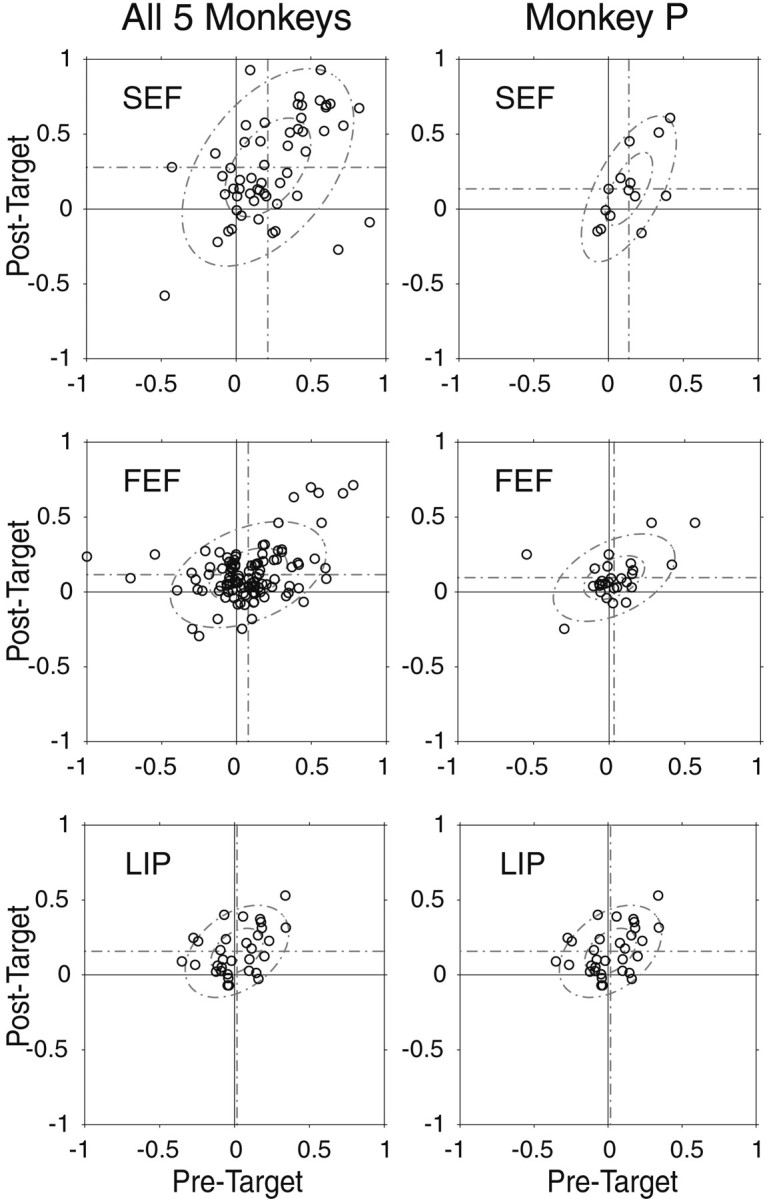
To examine the role of three cortical eye fields during internally guided decision-making processes, we recorded neuronal activities in the frontal eye field (FEF), supplementary eye field (SEF), and lateral intraparietal cortex (LIP) using a free-choice delayed saccade task with two synchronized targets. Although the monkeys must perform the task in a time-locked manner, they were free to choose either the receptive field (RF) target or the nonreceptive field (nRF) target to receive reward. In all three areas we found neurons with stronger activation during trials when the monkey was going to make a saccade to the RF target (RF trials) than to the nRF target (nRF trials). Modulation occurred not only during target presentation (visual bias) but also before target presentation (anticipatory bias). The visual bias was evident as an attenuated visual response to the RF stimulus in nRF trials. The anticipatory bias, however, was seen as an enhancement of pretarget activity in the RF trials. We analyzed the activity during the 500 msec before target presentation and found that 22.5% of FEF and 31.3% of LIP neurons and 49.1% of SEF neurons showed higher activity during the RF trials. To more accurately determine when each neuron started to show preferential activity, we used a new inverse interspike interval analysis procedure. Our results suggest that although all three cortical eye fields reflect attentional and intentional aspects of sensorimotor processing, SEF plays an earlier and perhaps more cognitive role in internally guided decision-making processes for saccades.


Figures

Fig. 1.
Fig. 1.
A schematic of the tasks. Left, The FC task. A, Fixation period. The subject must maintain fixation for 1200 msec. The gray ring indicates the RF of the cell. B, Visual period. Two targets come on but the subject must maintain fixation for another 800 msec.C, Saccade period. The fixation offset is the cue for the subject to make a saccade to the target inside the RF (RF target) or to the target outside the RF (nRF target). Successful trials in the FC task are categorized as RF trials and nRF trials based on the monkey's behavior. Right, The control task.A, Fixation period (same as the FC task).B, Visual period. Only one target is presented, and the subject must still maintain fixation for another 800 msec.C, Saccade period. The fixation offset is the cue for the subject to make a saccade to the target presented. Successful trials in the control task are referred to as RFc trials and nRFc trials based on the target presented. The white dotsrepresent the visual stimuli and are the only items visible to the subject. Large arrows indicate correct trial progression.Small arrows indicate saccades made. Sunburstsindicate fixation offset.
Fig. 2.
Fig. 2.
Explanation of the 1/ISI procedure and the Running Mann comparison. Sample data were taken from the cell in Figure4C. A, Rasters for 10 RF and 10 nRF trials. Ticks indicate neuronal spikes.B, 1/ISI data for individual RF trials from the raster above are superimposed. The 5 msec condensing process is shown at two sample time points. Each circle indicates the mean value for the 1/ISI data for each trial within the 5 msec time window. This was done at nonoverlapping 5 msec intervals for every trial in each block. C, The same as B but for the nRF trials from the raster above. D, TheZ scores from the running WMW tests between the two groups of condensed 1/ISI data from all of the RF and nRF trials (∼100 trials). The arrow indicates the onset of the differentiation of neuronal activity, which was defined as the first of at least 10 consecutive Z scores of >2.33 (p < 0.01). E, The 5 msec condensed data for all of the RF and nRF trials were then averaged across trials to form mean spike-frequency functions (black and gray solid lines, respectively). For comparison, the 10 msec bin peristimulus time histograms of the same data are plotted with dotted lines. The vertical dotted line indicates the onset of the differentiation of neuronal activity. See Materials and Methods for details.
Fig. 3.
Fig. 3.
Visual and motor responses of a typical cell in the right FEF during the FC task (top) and the control task (bottom). Plots are arranged by task and destination of saccade. For both tasks, the activities are shown separately for both kinds of trials where a saccade was made either to the target in the RF (RF target; left-down, 30°) or to the target outside the RF (nRF target; right-up, 30°). Rasters are in chronological order from top to bottom.Black ticks indicate neuronal spikes, and green bars indicate saccade onset and duration. One millisecond 1/ISI functions are directly above the rasters they represent and are color coded to match the target plots for each task. The 5 msec condensed 1/ISI, or 1/ISI plots, for each are overlaid in black. The shaded area in each plot indicates the visual period (0–800 msec), and the green line represents the mean saccade onset. The horizontal bar plots next to each raster indicate the percentage of reward for each trial. Colored sections represent the percentage of reward given for a saccade to the corresponding target. For the FC task, dark gray bars indicate amount of reward the monkey voluntarily skipped, and white bars indicate error trials in both tasks.
Fig. 4.
Fig. 4.
Strong modulation of visual response in three cortical eye fields. For a representative cell in each area, the 1/ISI plot is shown for the RF trials (black) and the nRF trials (gray) in the FC task. The difference in cell activity between the RF trials and the nRF trials is clearest during the visual period (shaded area).
Fig. 5.
Fig. 5.
Strong modulation of anticipatory activity in three cortical eye fields. For a representative cell in each area, the 1/ISI plot is shown for the RF trials (black) and the nRF trials (gray) in the FC task. The difference in cell activity between the RF trials and the nRF trials is clear in the fixation period, before the onset of the targets. The dotted line in each 1/ISI plot indicates the time when the activities for the RF trials and for the nRF trials first displayed a significant difference according to the Running Mann comparison (see Materials and Methods). The shaded area indicates the visual period.
Fig. 6.
Fig. 6.
Population plots for three cortical eye fields. For the three populations of cells, the mean 1/ISI plots are shown for the RF trials (solid black lines) and the nRF trials (solid gray lines) of the FC task and, for comparison, the RFc trials (dotted black lines) and the nRFc trials (dotted gray lines) of the control task. The population data are based on 55 cells in the SEF, 111 cells in FEF, and 32 cells in LIP from five monkeys. The shaded area indicates the visual period.
Fig. 7.
Fig. 7.
Distribution of Z scores for pretarget and post-target activity. The spike counts for the RF trials and the nRF trials were compared using the WMW test for two separate time windows. Histograms of the results indicate how many cells showed significantly different activity. Black bars indicate cells with Z scores above 2.58 (RF > nRF) or below −2.58 (nRF > RF; p < 0.01). Gray bars indicate cells with nonsignificant Zscores. Left, Pretarget time window: 49.1% (27 of 55) of SEF cells, 22.5% (25 of 111) of FEF cells, and 31.3% (10 of 32) of LIP cells show greater activity during the RF trials than during the nRF trials. Right, Post-target window: 67.3% (37 of 55) of SEF, 43.2% (48 of 111) of FEF, and 56.3% (18 of 32) of LIP cells show greater activity during the RF trials than during the nRF trials.
Fig. 8.
Fig. 8.
Normalized differential activity plots for three cortical eye fields of all five monkeys (left) and monkey P (right). Positive values indicate greater activity during the RF trials than during the nRF trials. Eachcircle represents a single neuron. In each plot,horizontal dotted lines represent the mean score for the post-target time window, and vertical dotted linesrepresent the mean score for the pretarget time window. Thesmall and large ellipses indicate the first and second SD of the bivariate normal distribution.
Fig. 9.
Fig. 9.
The onset of modulation predicting the monkey's decision to choose the RF target in three cortical eye fields. Cumulative histograms for each cortical area indicate when individual cells started showing preferential activity for the RF trials over the nRF trials as determined by the Running Mann comparison. Theshaded area indicates the visual period and thevertical line indicates fixation onset. The majority of visually responsive cells from all three areas showed modulation before the offset of the fixation point (800 msec). Although some cells in the FEF and LIP (∼30%) showed modulation before fixation onset, this type of modulation was more prevalent in cells in the SEF (58.2%). Three cells in the SEF showed predictive differentiated activation throughout the intertrial interval (indicated by the initial elevation). All three areas had some cells that never showed preferential activity for the RF trials in the FC task even after making a saccade (indicated by the final elevation on theright). Tgts, Targets.

References

    1. Amador N, Schlag-Rey M, Schlag J. Reward-predicting and reward-detecting neuronal activity in the primate supplementary eye field. J Neurophysiol. 2000;84:2166–2170. - PubMed
    1. Andersen RA, Gnadt JW. Posterior parietal cortex. In: Wurtz RH, Goldberg ME, editors. The neurobiology of saccadic eye movements. Elsevier; Amsterdam: 1989. pp. 315–335. - PubMed
    1. Barash S, Bracewell RM, Fogassi L, Gnadt JW, Andersen RA. Saccade-related activity in the lateral intraparietal area. I. Temporal properties; comparison with area 7a. J Neurophysiol. 1991a;66:1095–1108. - PubMed
    1. Barash S, Bracewell RM, Fogassi L, Gnadt JW, Andersen RA. Saccade-related activity in the lateral intraparietal area. II. Spatial properties. J Neurophysiol. 1991b;66:1109–1124. - PubMed
    1. Bowman EM, Aigner TG, Richmond BJ. Neural signals in the monkey ventral striatum related to motivation for juice and cocaine rewards. J Neurophysiol. 1996;75:1061–1073. - PubMed

Publication types

LinkOut - more resources