. 2002 Jun 15;22(12):5149-63.
doi: 10.1523/JNEUROSCI.22-12-05149.2002.

Parallel motion processing for the initiation of short-latency ocular following in humans

Affiliations

Parallel motion processing for the initiation of short-latency ocular following in humans

Guillaume S Masson et al. J Neurosci. .

Abstract

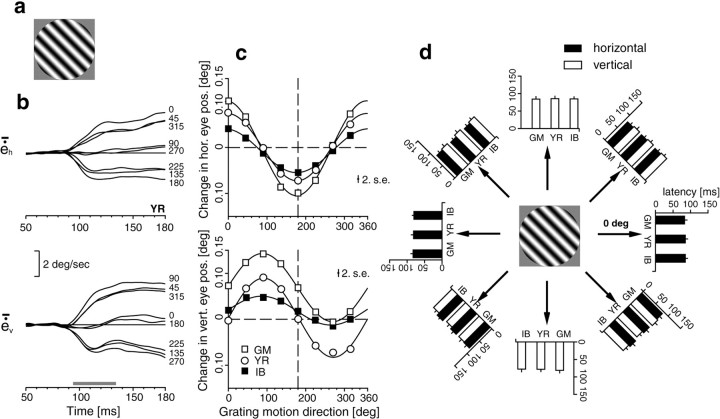
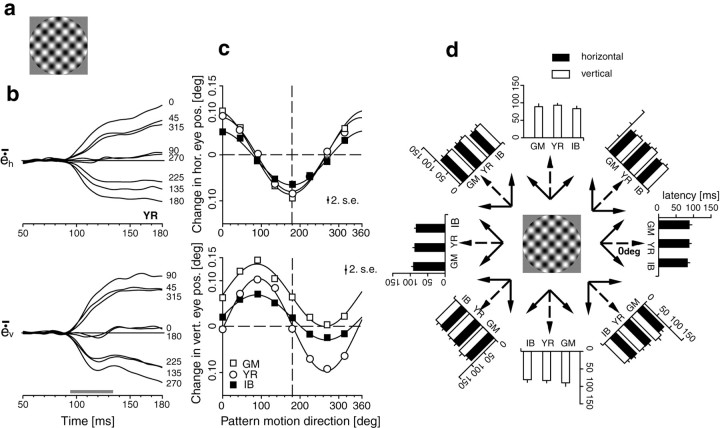
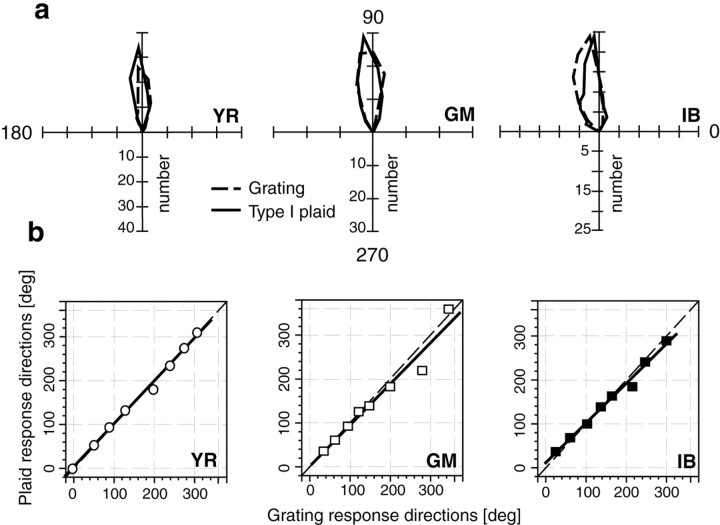
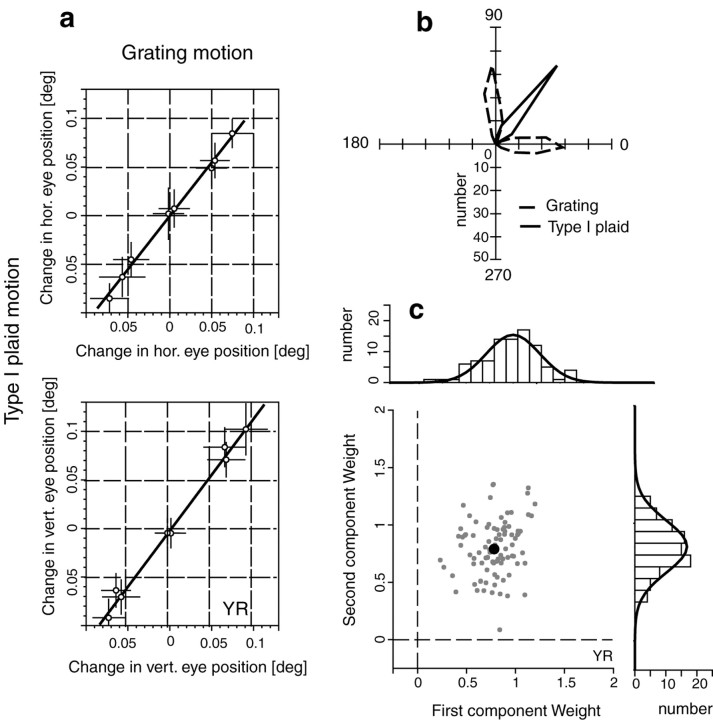
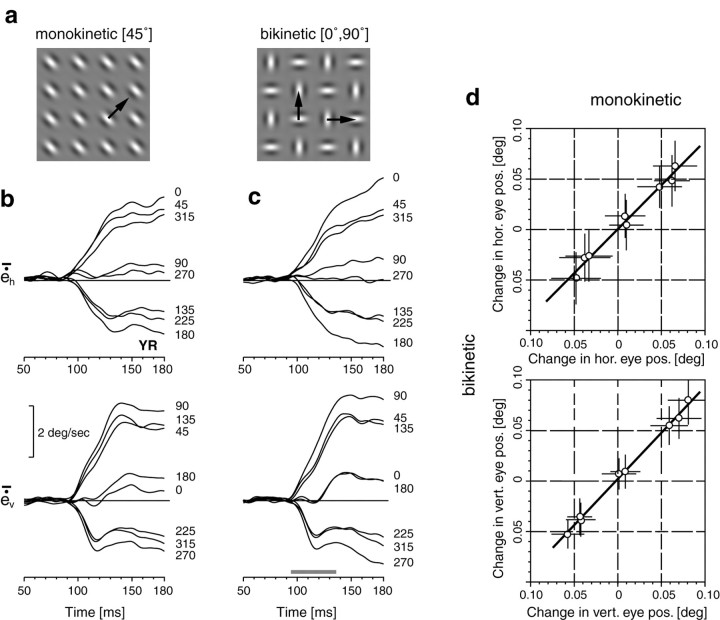
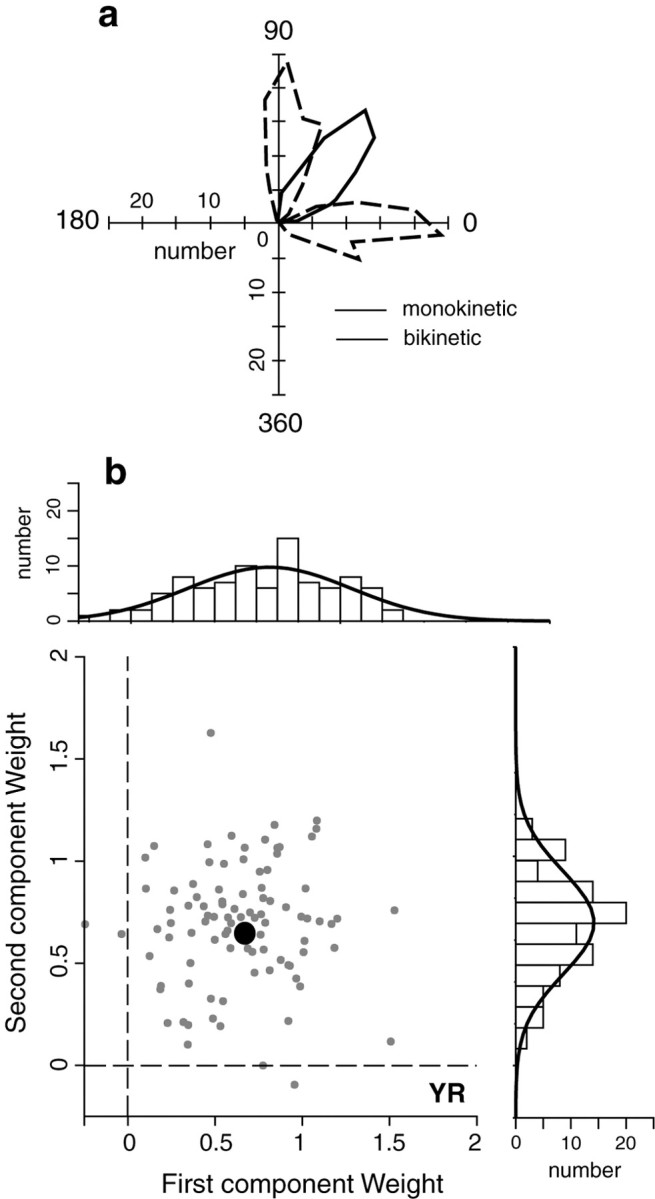
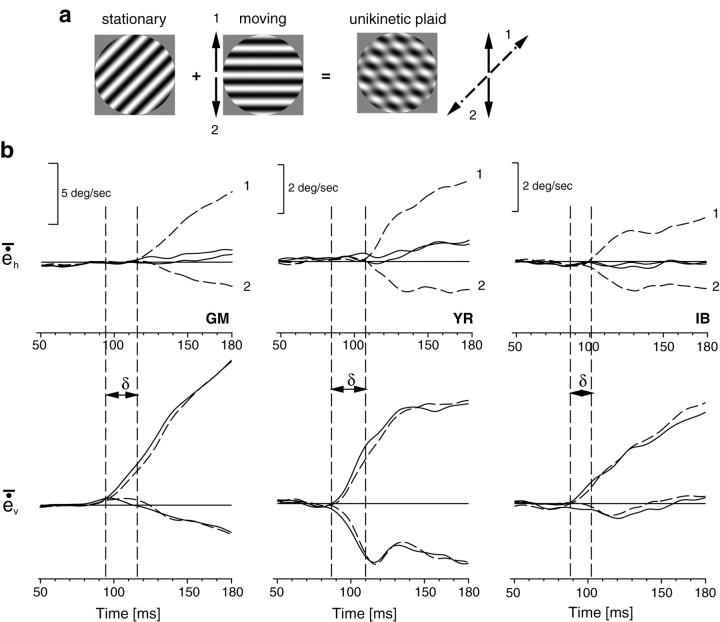
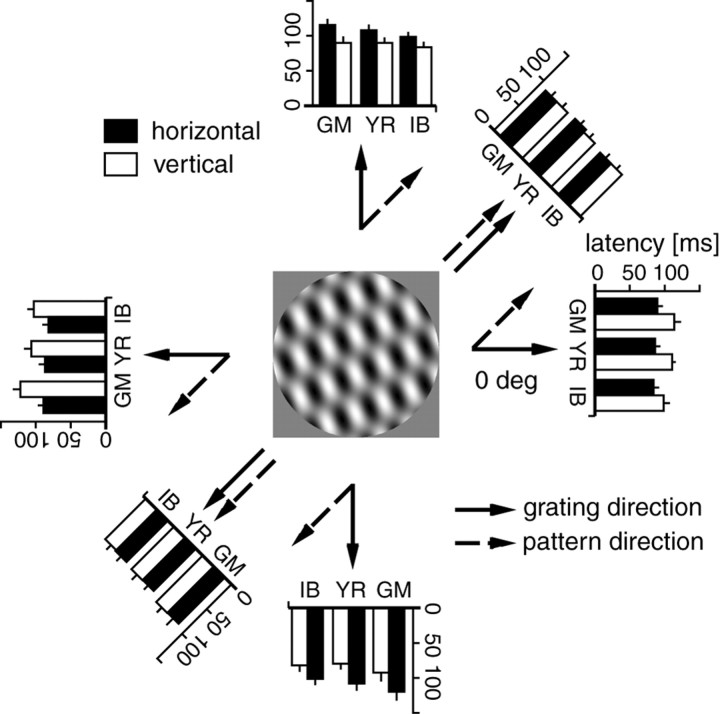
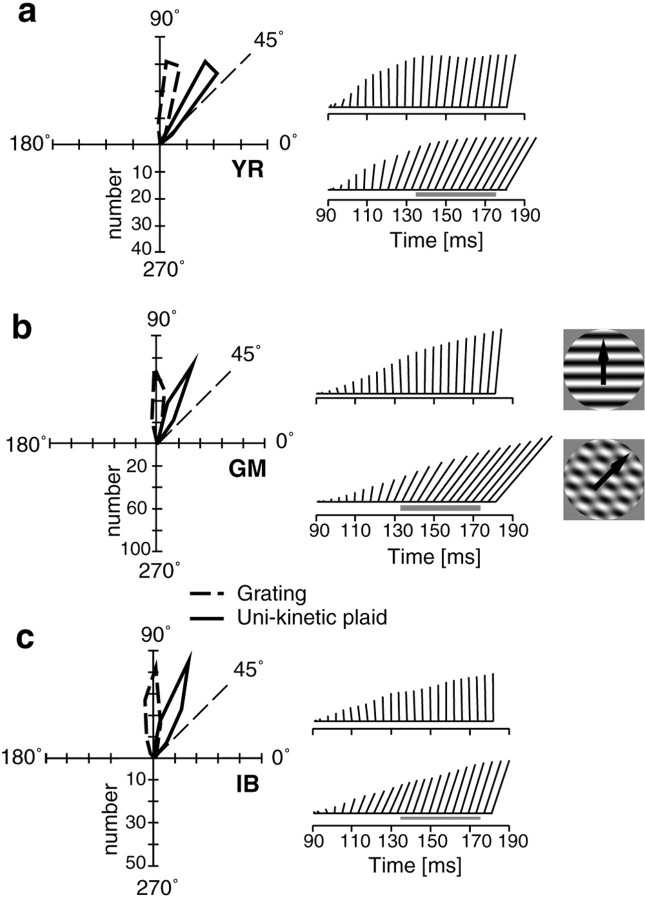
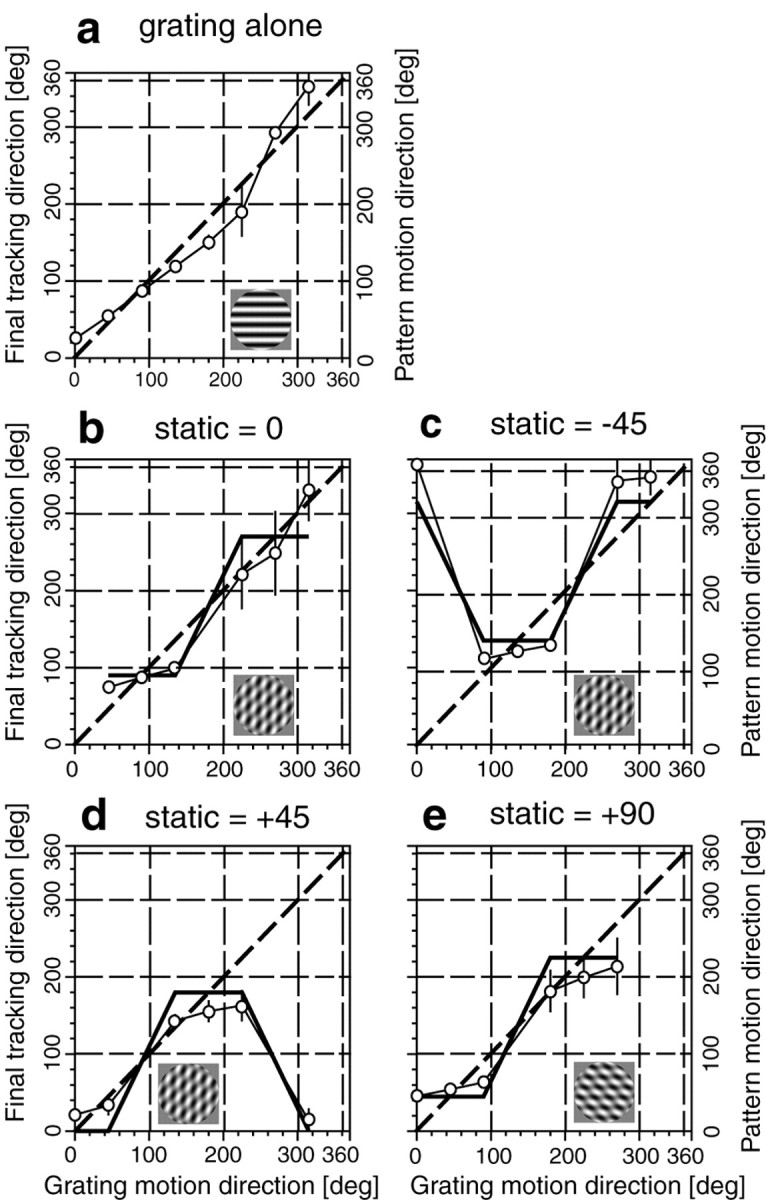
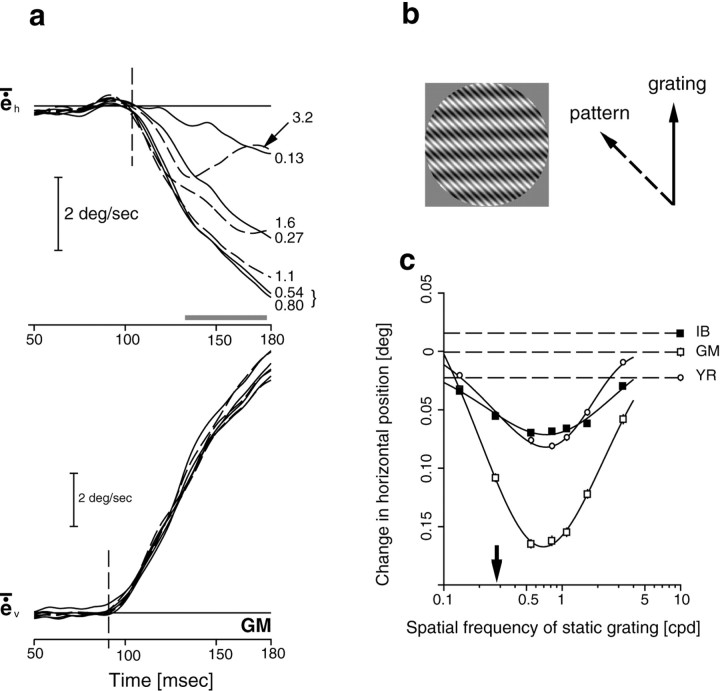
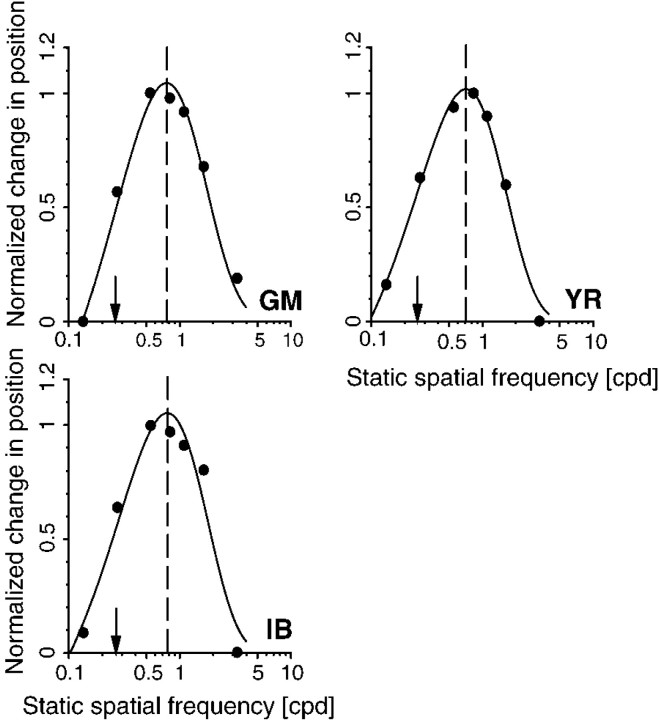
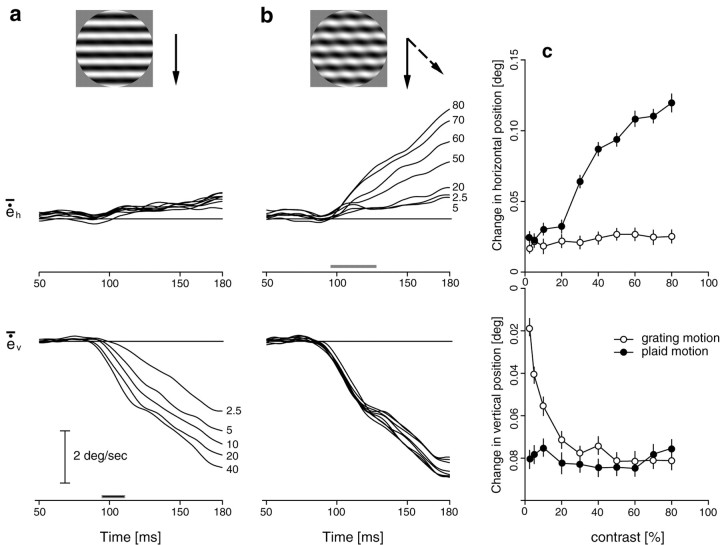
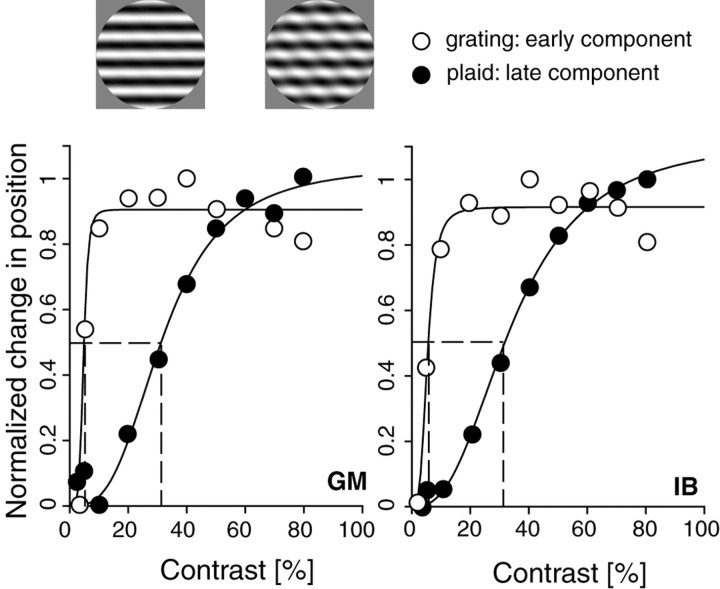
With the scleral search coil technique, we recorded ocular following responses elicited by either grating or plaid pattern motions. Grating motion elicited tracking responses at short latencies ( approximately 85 msec). Type I plaid motion made by summing two orthogonal moving gratings elicited ocular following with identical short latencies. Trial-by-trial vector decomposition showed that plaid-driven responses were best predicted by a vector average of the component-driven responses. Similar results were found with micropatterns made of 16 Gabor patches with drifting carriers of two different orientations. "Unikinetic" plaids were constructed by summing a moving and stationary grating, with a 45 degrees orientation difference, so that component and pattern motion directions were separated by 45 degrees. Eye movements exhibited two components. Ocular following was first initiated in the grating motion direction, at ultra-short latency. A second component was initiated approximately 20 msec later, curving the responses toward the pattern motion direction. The later component was specifically, and independently, affected by both relative spatial frequency and contrast between component gratings. The early response components showed a much steeper contrast response function than the late component. These results suggest that initial ocular following is underpinned by parallel processing of component- and pattern-related velocities followed by an integrative stage that computes the two-dimensional surface motion.


Figures

Fig. 1.
Fig. 1.
Ocular following responses to grating motion.a, One frame of the low spatial frequency grating seen through a 20° diameter circular aperture. b, Mean horizontal (e⨪h) and vertical (e⨪v) eye velocity profiles to eight different grating motion directions, indicated by right-hand numbers. c, Individual mean changes in horizontal (top plot) and vertical (bottom plot) positions, over a 95–135 msec time window (gray bar, plots b), as a function of grating motion direction. Continuous lines are best-fitting sine functions. d, Latency of ocular following responses. For each grating motion direction,white and black bars indicate mean (±SD) latency of horizontal and vertical eye movements, respectively, for each subject. Notice that for horizontal (vertical) grating motion, latencies can be measured only for the horizontal (vertical) eye movements.
Fig. 2.
Fig. 2.
Ocular following responses to type I plaid motion.a, One frame of a low spatial frequency plaid pattern seen through a 20° diameter circular aperture. b, Mean horizontal (e⨪h) and vertical (e⨪v) eye velocity profiles to eight different pattern motion directions, indicated by right-hand numbers. c, Individual mean changes in horizontal and vertical position, over a 95–135 msec time window (gray bar, plots b), as a function of pattern direction. d, Latency of ocular following responses. For each plaid motion direction (broken arrow),white and black bars indicate mean (±SD) latency of horizontal and vertical eye movements, respectively, for each subject. Notice that for horizontal (vertical) plaid motion, latencies can be measured only for the horizontal (vertical) eye movements.
Fig. 3.
Fig. 3.
Direction of tracking responses.a, Polar plots of the frequency distribution of tracking direction over the 95–135 msec time window, in response to either a single grating (broken lines) or a plaid pattern (continuous line) moving upward. b, Relationships between mean tracking directions of response to plaid versus grating motion. Broken lines indicate the identity line where tracking direction accuracy for either grating or plaid stimuli is identical.
Fig. 4.
Fig. 4.
Relationship between grating- and plaid-driven responses. a, For each stimulus motion direction, mean (±SD) change in horizontal (top plot) and vertical (bottom plot) positions for grating and plaid conditions are plotted one against each other. b, For each trial, the 2D response vector to a type I plaid moving along the +45° direction is decomposed as the weighted sum of the mean 2D response vectors observed with horizontal (0°) and vertical (90°) grating motions. Frequency histograms of first and second component weights are plotted together with the best-fit Gaussian function to indicate that weights follow unimodal distributions. Weight pairs are also plotted on a scatterplot, with mean weight pairs indicated by theblack dot. c, Polar plot of frequency distributions of 2D tracking directions for responses to a moving plaid (continuous lines) or to its grating components (broken lines).
Fig. 5.
Fig. 5.
Ocular following responses to micropatterns.a, One frame of a monokinetic or a bikinetic micropattern made of 16 Gabor patches. Global motion directions are identical for both patterns. b, Mean horizontal (e⨪h) and vertical (e⨪v) eye velocity profiles to eight different monokinetic pattern motion directions, indicated by right-hand numbers. Compare with the ocular following responses observed with bikinetic patterns moving in the same global motion directions (c). d, Mean (±SD) changes in horizontal (top plot) or vertical (bottom plot) directions observed with either monokinetic or bikinetic patterns are plotted against each other.
Fig. 6.
Fig. 6.
Vector decomposition of responses to bikinetic patterns. The analysis of 2D vectors of tracking responses is shown for one subject (Y.R.) when presented with either monokinetic (rightward or upward carrier motions) or bikinetic (rightward and upward carrier motions) micropatterns. a, First and second component weights are plotted against each other, for each trial. Black dot indicates the mean weight pair. The frequency distributions of each weight are also plotted as histograms (b, c) together with best-fit Gaussian functions. d, Polar plot of the frequency distribution for the 2D tracking direction of responses to monokinetic (broken lines) or bikinetic patterns.
Fig. 7.
Fig. 7.
Tracking responses to type II unikinetic plaid motion. a, Two examples of motion stimuli. For upward grating motion (1), pattern moves rightward and upward; for downward grating motion (2), pattern moves leftward and downward. b, Horizontal (e⨪h) and vertical (e⨪v) velocity profiles for three subjects, in response to single grating motion (continuous lines) or to moving plaids (dashed lines). Vertical dotted lines plot the mean latency estimates of both horizontal and vertical eye movements to plaid motion, yielding a mean latency difference (δ) of ∼20 msec.
Fig. 8.
Fig. 8.
Latency of early and late tracking components. Mean (±SD) latency of vertical and horizontal eye movements in response to unikinetic plaids. For all conditions, the static grating is tilted −45°. Six different grating motion directions are illustrated (continuous arrows), corresponding to six different pattern motion directions (broken arrows). When grating and pattern are in the same direction, no difference between vertical and horizontal latencies are observed. When grating and pattern directions differ by 45°, latencies are systematically shorter in the direction of the grating motion.
Fig. 9.
Fig. 9.
Tracking direction of responses to unikinetic plaids. For each subject (a–c), the left panel plots the frequency distribution of 2D tracking direction for responses to either a single grating moving upward (broken lines) or a plaid pattern moving upward and rightward (45°) (continuous lines). Right panel plots the instantaneous mean velocity vector of responses to either grating or type II plaids. Vectors are computed from mean horizontal and vertical velocity profiles (see Fig. 7) and shown every 4 msec.
Fig. 10.
Fig. 10.
Predicted and observed tracking direction. Mean (±SD across observers) final tracking directions are plotted against grating motion direction for a single grating (a) or for four type II plaids with different static grating orientations (c–e). Broken thick lines indicate the predicted tracking direction if ocular responses are driven solely by grating motion. Continuous thick lines indicate the predicted tracking direction if ocular responses are driven solely by pattern motion (right-hand axis).
Fig. 11.
Fig. 11.
Effect of relative spatial frequency.a, Mean horizontal and vertical velocity profiles of ocular following responses to unikinetic plaids of different static spatial frequencies (right-hand numbers). The spatial frequency of the moving grating and static grating orientation are kept constant. Grating motion is upward, and plaid pattern motion is upward and leftward (b). c, Change in horizontal position, as a function of static spatial frequency, for three subjects. Horizontal broken lines indicate for each subject the residual change in horizontal position observed with a pure upward grating motion. Arrow indicates the spatial frequency of the moving grating.
Fig. 12.
Fig. 12.
Relative spatial frequency tuning functions. For each subject, normalized changes in position are plotted against the spatial frequency of the static, oblique grating, for the upward grating motion condition. Continuous lines are best-fit double-exponential functions. Vertical dotted linesindicate the peak location of the tuning function.Arrows indicate the spatial frequency of the moving grating.
Fig. 13.
Fig. 13.
Effect of contrast on early and late tracking component. a, The contrast of a vertical grating, moving downward was varied. No changes were evident in the mean vertical eye velocity profiles, but grating contrast strongly modulated the mean vertical eye velocity. b, The contrast of the static grating was varied from 2.5 to 80%. No effect was seen on the vertical eye velocity, whereas delayed, horizontal eye movements were strongly affected. Increasing the static contrast increased the initial horizontal eye velocity. c, Change in horizontal (top plot) and vertical (bottom plot) positions of ocular following responses, to either single grating (open symbols) or plaid pattern (closed symbols) motion, as a function of stimulus contrast. Changes in position are computed over the 95–115 or the 95–135 msec time window for grating or plaid motion conditions, respectively.
Fig. 14.
Fig. 14.
Contrast response functions. For two subjects, the normalized changes in position are plotted against contrast.Continuous lines are best-fit Naka–Rushton functions.Vertical dotted lines indicate the half-saturation values of the contrast response functions. Open symbolsplot the amplitude of early vertical responses, as a function of moving grating contrast. Closed symbols plot the amplitude of late, horizontal responses, as a function of static grating contrast.

Similar articles

Cited by

References

    1. Adelson EH, Movshon JA. Phenomenal coherence of moving visual pattern. Nature. 1982;300:523–525. - PubMed
    1. Albrecht DG, Hamilton DB. Striate cortex of monkey and cat: Contrast response function. J Neurophysiol. 1982;48:217–237. - PubMed
    1. Albright TD. Form-cue invariant motion processing in primate visual cortex. Science. 1992;255:1141–1143. - PubMed
    1. Blakemore C, Campbell FW. On the existence of neurones in the human visual cortex selectively sensitive to the orientation and size of retinal images. J Physiol (Lond) 1969;203:237–260. - PMC - PubMed
    1. Boulton JB, Baker CL. Motion detection is dependent on spatial frequency not size. Vision Res. 1991;31:77–87. - PubMed

Publication types

LinkOut - more resources