. 2002 Jun 15;22(12):5173-87.
doi: 10.1523/JNEUROSCI.22-12-05173.2002.

Activation of ventral tegmental area cells by the bed nucleus of the stria terminalis: a novel excitatory amino acid input to midbrain dopamine neurons

Affiliations

Activation of ventral tegmental area cells by the bed nucleus of the stria terminalis: a novel excitatory amino acid input to midbrain dopamine neurons

François Georges et al. J Neurosci. .

Abstract

We examined the role of excitatory amino acids (EAAs) in the activation of midbrain dopaminergic (DA) neurons evoked by stimulation of the ventromedial and ventrolateral (subcommissural) bed nucleus of the stria terminalis (vBNST). Using anesthetized rats and extracellular recording techniques, we found that 84.8% of ventral tegmental area (VTA) DA neurons were activated synaptically by single-pulse electrical stimulation of the vBNST. In contrast, similar stimulation did not affect the activity of presumed GABA neurons in the VTA. Three characteristic responses were observed in VTA DA neurons: short latency activation (<25 msec; 55.1% of cells), long latency activation (>65 msec; 56% of cells), and inhibition (61.8% of cells, usually followed by long latency excitation). Microinfusion of antagonists of EAA receptors (3 mm kynurenic acid, 100 microm AP-5, or 50 microm CNQX) from a micropipette adjacent to the recording electrode significantly reduced both short and long latency activations evoked in DA neurons by vBNST stimulation. Specific responses were attenuated similarly by AP-5 alone, CNQX alone, or a cocktail of AP-5+CNQX, indicating that joint activation of NMDA plus non-NMDA receptors was required. Stimulation of the vBNST by local microinfusion of glutamate increased the firing and bursting activity of VTA DA neurons. Similar microinfusion of GABA decreased bursting of VTA DA neurons without altering their firing rate. Retrograde and anterograde labeling and antidromic activation of vBNST neurons by VTA stimulation confirmed a direct projection from the vBNST to the VTA. These results reveal that inputs from the vBNST exert a strong excitatory influence on VTA DA neurons mediated by both NMDA and non-NMDA receptors.


Figures

Fig. 1.
Fig. 1.
Stimulation and recording sites. A, B, Photomicrographs of coronal sections through two levels of the BNST. The sections were counterstained with DBH immunohistochemistry (dark staining) to delineate the region of dense noradrenergic innervation in the vBNST. White crosses show effective sites of electrical stimulation.Black crosses show the locations of three ineffective electrical stimulation sites in the caudate putamen or in the lateral preoptic area. White and graycircles show locations of effective Glu and GABA microinjections, respectively. Blackcircles depict ineffective microinjections of GABA in the lateral hypothalamus or in the substantia innominata. Ineffective Glu injections in the lateral preoptic area and ventral pallidum are plotted in our recent publication (Georges and Aston-Jones, 2001).C, An electrical stimulation site in the DBH-positive area of the vBNST, marked by passing current through the stimulation electrode (dark lesioned area, arrow).D, Iontophoretic injection of pontamine sky blue (dark spot, arrow; coronal section) marks the recording location for a VTA DA neuron (neutral red stain). Scale bars: A, B, D, 0.5 mm; C, 1.0 mm.
Fig. 2.
Fig. 2.
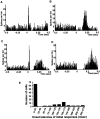
Typical peristimulus time histograms (PSTHs) showing vBNST-evoked excitation and inhibition in four VTA DA neurons. Three characteristic responses were observed after single-pulse stimulation of the vBNST: activation with short latency (<25 msec; A, C), activation with long latency (>65 msec; B, D), or inhibition often associated with a long latency excitation (D). For all PSTHs here and in subsequent figures, stimulation was at time 0; bin width was 10 msec, and 100 sweeps were collected. E, Histogram of the distribution of onset latencies for initial excitatory responses of VTA DA neuronal responses driven by single-pulse stimulation of the vBNST. Note that electrical stimulation of the vBNST produced two distinct excitatory responses: activation with a short or long onset latency.
Fig. 3.
Fig. 3.
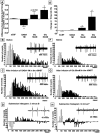
Modulation of burst firing and firing rate in VTA DA neurons by the vBNST. A, E, Infusion of 1m GABA into the vBNST caused a decrease in burst firing without affecting the firing rate of VTA DA neurons. Microinjection of 10 or 50 mm Glu into the vBNST increased both firing rate and bursting activity of VTA DA cells. For burst-firing analysis the scores that are plotted are the percentage of spikes in bursts postdrug minus the percentage of spikes in bursts predrug. For firing rates the scores that are plotted are the change in rates postdrug as a percentage of predrug rates. ANOVAs followed by Student'st tests for pairwise comparisons were performed for bursting activity and firing rate. *p < 0.05 versus control (aCSF). B, C, F, G, Interspike interval histograms (5 msec bins) illustrating the firing pattern of two VTA DA neurons before and after the infusion of 1m GABA (B, C) or before and after the infusion of 50 mm Glu into the vBNST (F, G).Insets show corresponding microelectrode traces before and after microinjections of GABA or Glu. D, H, Subtraction histograms comparing the bursting activity before and after microinjections of GABA or Glu, respectively. D showsC minus B (effect of GABA), whereasH shows G minus F (effect of Glu). Insets show corresponding microelectrode traces before microinjections of GABA or Glu. In B–D andF–H, open bars indicate the number of spikes occurring in bursts (interspike intervals <80 msec), andfilled bars indicate the number of spikes occurring outside of bursts (interspike intervals >80 msec). Note the decrease in bursting activity of VTA DA neurons after microinjection of GABA into the vBNST (B–D, open bars) and the increase in bursting activity of VTA DA neurons after microinjection of Glu into the vBNST (F–H, open bars).
Fig. 4.
Fig. 4.
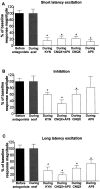
Graphs illustrating the effects of EAA antagonists on the three characteristic responses obtained after stimulation of the vBNST. Scores that are plotted are percentages ofRmags (± SEM) for VTA DA neuronal responses evoked by vBNST electrical stimulation before (black bars) and during microinjection of aCSF (gray bars) or EAA antagonists (white bars). Notably, NMDA or non-NMDA receptor antagonists significantly reduced short and long latency excitation evoked in DA neurons by vBNST stimulation. Only kynurenic acid, CNQX alone, and the mixture of CNQX+AP-5 antagonists significantly reduced the inhibition evoked in DA neurons by vBNST stimulation. For drug concentrations and cell numbers that were tested for each pharmacological agent, refer to Figures 5-8. An ANOVA followed by Student's t test for pairwise comparisons was performed for each characteristic response: short latency activation, inhibition, and long latency activation. *p < 0.05.
Fig. 5.
Fig. 5.
Effects of kynurenic acid on VTA DA neuronal responses evoked by BNST electrical stimulation.A–D, PSTHs showing VTA-evoked responses before and during kynurenate injection into the VTA for two typical DA neurons. Single-pulse stimuli (5 mA, 0.5 msec, 0.5/sec) were delivered at time 0. E, Mean ± SEM Rmags of VTA DA neuronal responses evoked by vBNST stimulation before (black bars) and during (white bars) microinjection of 3 mm kynurenic acid into the VTA. Microinjection of kynurenic acid prevented the short latency activation of DA VTA neurons evoked by electrical stimulation of the vBNST and decreased the inhibition and long latency excitation. The same cells were used before and after drug application (n = 15). An ANOVA followed by Student's t test for pairwise comparisons was performed for each characteristic response: short latency activation, inhibition, and long latency activation. *p < 0.05.
Fig. 6.
Fig. 6.
Effects of AP-5+CNQX on VTA DA neuronal responses evoked by BNST electrical stimulation. A–D, PSTHs showing VTA-evoked responses before and during drug injection into the VTA for two typical DA neurons. Single-pulse stimuli (5 mA, 0.5 msec, 0.5/sec) were delivered at time 0. E, Mean ± SEM Rmags of VTA DA neuronal responses evoked by vBNST stimulation before (black bars) and during (white bars) microinjection of 100 μm AP-5 plus 50 μm CNQX into the VTA. Microinjection of AP-5+CNQX prevented the short latency activation of DA VTA neurons evoked by vBNST stimulation and decreased the inhibition and long latency excitation. The same cells were used before and after drug application (n = 11). An ANOVA followed by Student's t test for pairwise comparisons was performed for each characteristic response: short onset latency activation, inhibition, and long onset latency. *p < 0.05.
Fig. 7.
Fig. 7.
Effects of CNQX on VTA DA neuronal responses evoked by BNST electrical stimulation. A–D, PSTHs showing VTA-evoked responses before and during CNQX injection into the VTA for two typical DA neurons. Single-pulse stimuli (5 mA, 0.5 msec, 0.5/sec) were delivered at time 0. E, Mean ± SEM Rmags of VTA DA neuronal responses evoked by vBNST stimulation before (black bars) and during (white bars) microinjection of 50 μm CNQX into the VTA. Microinjection of CNQX prevented the short latency activation of DA VTA neurons evoked by vBNST stimulation and decreased the long latency excitation. The same cells were used before and after drug application (n = 20). An ANOVA followed by Student's t test for pairwise comparisons was performed for each characteristic response: short latency activation, inhibition, and long latency activation. *p < 0.05.
Fig. 8.
Fig. 8.
Effects of AP-5 on VTA DA neuronal responses evoked by BNST electrical stimulation. A–D, PSTHs showing VTA-evoked responses before and during AP-5 injection into the VTA for two typical DA neurons. Single-pulse stimuli (5 mA, 0.5 msec, 0.5/sec) were delivered at time 0. E, Mean ± SEM Rmags of VTA DA neuronal responses evoked by vBNST stimulation before (black bars) and during (white bars) microinjection of 100 μm AP-5 into the VTA. Microinjection of AP-5 prevented the short latency activation of DA VTA neurons evoked by vBNST stimulation and decreased the long latency excitation. The same cells were used before and after drug application (n = 15). An ANOVA followed by Student'st test for pairwise comparisons was performed for each characteristic response: short latency activation, inhibition, and long latency activation. *p < 0.05.
Fig. 9.
Fig. 9.
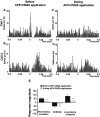
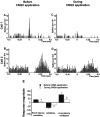
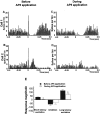
Effects of AP-5 plus CNQX on VTA DA neuronal responses evoked by BNST stimulation by Glu microinjection. A, B, Graphs comparing bursts (A) and firing rate (B) of VTA DA neurons before (control) and during local microinfusion of 50 μm CNQX plus 100 μm AP-5 into the VTA. Note that the EAA antagonists blocked both the increase in bursting as well as the increase in firing rate of VTA DA neurons evoked by chemical stimulation of the vBNST. Data are the results from eight neurons recorded in four rats. Data were analyzed by two-way ANOVA to determine possible interactions between Glu and EAA antagonists. ForA, F = 4.901 andp = 0.035; for B,F = 4.778 and p = 0.037. *p < 0.01 compared with before Glu (paired Student's t tests). C, D, Firing rate histograms showing the blockade of response in a typical VTA DA neuron to Glu stimulation of the vBNST with local microinjection of 50 μm CNQX plus 100 μm AP-5 into the VTA. In C, note the activation of the VTA neuron by Glu stimulation of the vBNST and the lack of such activation when Glu was applied in the vBNST during EAA antagonist microinfusion in the VTA, as marked above. Note also the elevated activity of the VTA neuron after the end of the EAA antagonist microinfusion, with oscillatory activity as typically observed with 50 mm Glu injection into the vBNST (Georges and Aston-Jones, 2001). D shows the period of Glu stimulation of the vBNST during EAA antagonist microinfusion into the VTA in greater temporal detail. Injection of Glu into the dorsocaudal BNST did not activate any of the four VTA DA neurons that were tested.
Fig. 10.
Fig. 10.
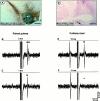
Characteristic antidromic response of a vBNST neuron after VTA stimulation. A, D, Photomicrographs of coronal sections through the VTA and the BNST showing stimulation and recording sites. A, An electrical stimulation site in the VTA, marked by passing positive current through the stimulation electrode (dark lesioned area, arrow). Tissue was stained for TH (brown) to indicate the DA neuron area. D, Iontophoretic injection of pontamine sky blue (dark spot, arrow; coronal section) marks the recording location for a vBNST neuron (neutral red stain). Scale bars: A, 0.5 mm; D, 1.0 mm. B, C, E, F, Five superimposed traces illustrating high-frequency activation and collision test for a vBNST cell driven from the VTA. B, Driven spikes (black circles) elicited by each of the paired stimuli (vertical lines; 2 msec interpulse interval) indicating the frequency following for this cell at 500 Hz. The second driven spike is smaller than the first, presumably showing an isolated axon spike and failure to invade the soma-dendritic membrane. C, Spikes driven by the second stimulus are occluded when the interpulse interval is decreased to 1 msec.E, Stimulation of VTA (vertical lines) 12 msec after spontaneous spikes (left side of traces) elicit driven spikes (black circle) at 13.1 msec latency. F, Driven spikes are occluded for similar stimuli delivered 11 msec after spontaneous impulses, indicating collision between spontaneous and driven spikes. Theasterisk signifies where driven spikes would have occurred had there been no collision. Calibration in Fapplies to B, C, E, F.
Fig. 11.
Fig. 11.
Projection from the vBNST to the VTA revealed by retrograde labeling in the vBNST after injection of CTb into the VTA.A, Schematic diagram illustrating the location of CTb injections in the VTA. B, Photomicrograph illustrating a representative CTb injection site in the VTA (dark bluelabeling). The section has been counterstained with TH immunohistochemistry (in brown), to delineate dopamine neurons and processes in the VTA (boxed area inA). C, D, Bright-field photomicrographs illustrating retrograde labeling in the vBNST after CTb injection into the VTA. The sections have been processed dually for CTb (dark blue) and DBH (brown). Note that numerous CTb+ cell bodies are observed in the dorsal and ventral BNST. Cell bodies retrogradely labeled in the vBNST are shown at higher power in D. ac, Anterior commissure; MM, medial mamillary nucleus. Scale bars:B, C, 1.0 mm; D, 0.1 mm.
Fig. 12.
Fig. 12.
Projection from the vBNST to the VTA revealed by anterograde transport of CTb to the VTA after injection into the vBNST.A, Photomicrograph showing a representative iontophoretic CTb injection site in the vBNST (dark bluelabeling). The section has been counterstained with DBH immunohistochemistry (in brown) to delineate the region of dense noradrenergic innervation in the BNST. B–D, Photomicrographs of the anterograde transport of CTb in the VTA after injection into the vBNST. B, C, Adjacent sections counterstained with CTb immunohistochemistry (C, which is enlarged in D) or TH immunohistochemistry (B) confirmed the overlap between CTb+ terminals (dark blue punctate labeling) and TH+ neurons and processes in the VTA. Note that anterogradely labeled CTb terminals from the vBNST (dark blue dots) are distributed throughout the VTA (D). ac, Anterior commissure;fr, fasciculus retroflexus. Scale bars,A–C, 1.0 mm; D, 0.1 mm.

Similar articles

Cited by

References

    1. Acquas E, Di Chiara G. Depression of mesolimbic dopamine transmission and sensitization to morphine during opiate abstinence. J Neurochem. 1992;58:1620–1625. - PubMed
    1. Aghajanian GK, Bunney BS. Dopamine “autoreceptors”: pharmacological characterization by microiontophoretic single cell recording studies. Naunyn Schmiedebergs Arch Pharmacol. 1977;297:1–7. - PubMed
    1. Akaoka H, Aston-Jones G. Opiate withdrawal-induced hyperactivity of locus coeruleus neurons is substantially mediated by augmented excitatory amino acid input. J Neurosci. 1991;11:3830–3839. - PMC - PubMed
    1. Ascher P, Nowak L. The role of divalent cations in the N-methyl-d-aspartate responses of mouse central neurones in culture. J Physiol (Lond) 1988;399:247–266. - PMC - PubMed
    1. Aston-Jones G, Shaver R, Dinan TG. Nucleus basalis neurons exhibit axonal branching with decreased impulse conduction velocity in rat cerebrocortex. Brain Res. 1985;325:271–285. - PubMed

Publication types

MeSH terms

LinkOut - more resources