Transcriptional collision between convergent genes in budding yeast
- PMID: 12077310
- PMCID: PMC124378
- DOI: 10.1073/pnas.132270899
Transcriptional collision between convergent genes in budding yeast
Abstract
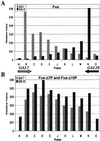
Transcriptional interference between genes and the regulatory elements of simple eukaryotes such as Saccharomyces cerevisiae is an unavoidable consequence of their compressed genetic arrangement. We have shown previously that with the tandem arranged genes GAL10 and GAL7, inefficient transcriptional termination of the upstream gene inhibits initiation of transcription on the downstream gene. We now show that transcriptional interference can occur also with S. cerevisiae RNA polymerase II genes arranged convergently. We demonstrate that when the GAL10 and GAL7 genes are rearranged in a convergent orientation, transcriptional initiation occurs at full levels. However, as soon as the two transcripts begin to overlap, elongation is restricted, resulting in a severe reduction in steady-state mRNA accumulation. This effect is observed only in cis arrangement, arguing against RNA-interference effects acting on the potential generation of antisense transcripts. These data reinforce the necessity of separating adjacent RNA polymerase II transcription units by efficient termination signals.
Figures


Similar articles
-
Balancing transcriptional interference and initiation on the GAL7 promoter of Saccharomyces cerevisiae.Proc Natl Acad Sci U S A. 2000 Jul 18;97(15):8415-20. doi: 10.1073/pnas.140217697. Proc Natl Acad Sci U S A. 2000. PMID: 10890898 Free PMC article.
-
Poly(A) signals control both transcriptional termination and initiation between the tandem GAL10 and GAL7 genes of Saccharomyces cerevisiae.EMBO J. 1998 Aug 17;17(16):4771-9. doi: 10.1093/emboj/17.16.4771. EMBO J. 1998. PMID: 9707436 Free PMC article.
-
Transcriptional interference and gene orientation in yeast: noncoding RNA connections.Cold Spring Harb Symp Quant Biol. 2010;75:299-311. doi: 10.1101/sqb.2010.75.048. Epub 2011 Apr 5. Cold Spring Harb Symp Quant Biol. 2010. PMID: 21467144
-
Molecular basis of transcriptional silencing in budding yeast.Biochem Cell Biol. 2004 Aug;82(4):413-8. doi: 10.1139/o04-035. Biochem Cell Biol. 2004. PMID: 15284893 Review.
-
Transcriptional interference: an unexpected layer of complexity in gene regulation.J Cell Sci. 2007 Aug 15;120(Pt 16):2755-61. doi: 10.1242/jcs.007633. J Cell Sci. 2007. PMID: 17690303 Review.
Cited by
-
Global mapping of DNA conformational flexibility on Saccharomyces cerevisiae.PLoS Comput Biol. 2015 Apr 10;11(4):e1004136. doi: 10.1371/journal.pcbi.1004136. eCollection 2015 Apr. PLoS Comput Biol. 2015. PMID: 25860149 Free PMC article.
-
Navigating the Multiverse of Antisense RNAs: The Transcription- and RNA-Dependent Dimension.Noncoding RNA. 2022 Oct 26;8(6):74. doi: 10.3390/ncrna8060074. Noncoding RNA. 2022. PMID: 36412909 Free PMC article. Review.
-
A defensin from tomato with dual function in defense and development.Plant Mol Biol. 2009 Sep;71(1-2):131-43. doi: 10.1007/s11103-009-9512-z. Epub 2009 Jun 16. Plant Mol Biol. 2009. PMID: 19533379
-
3' Untranslated regions mediate transcriptional interference between convergent genes both locally and ectopically in Saccharomyces cerevisiae.PLoS Genet. 2014 Jan;10(1):e1004021. doi: 10.1371/journal.pgen.1004021. Epub 2014 Jan 23. PLoS Genet. 2014. PMID: 24465217 Free PMC article.
-
Suppression of expression between adjacent genes within heterologous modules in yeast.G3 (Bethesda). 2014 Jan 10;4(1):109-16. doi: 10.1534/g3.113.007922. G3 (Bethesda). 2014. PMID: 24281423 Free PMC article.
References
Publication types
MeSH terms
Substances
LinkOut - more resources
Full Text Sources
Other Literature Sources
Molecular Biology Databases

