. 2002 Jul;22(14):5006-18.
doi: 10.1128/MCB.22.14.5006-5018.2002.

The absence of Tssc6, a member of the tetraspanin superfamily, does not affect lymphoid development but enhances in vitro T-cell proliferative responses

Affiliations

The absence of Tssc6, a member of the tetraspanin superfamily, does not affect lymphoid development but enhances in vitro T-cell proliferative responses

Jacqueline M Tarrant et al. Mol Cell Biol. 2002 Jul.

Abstract

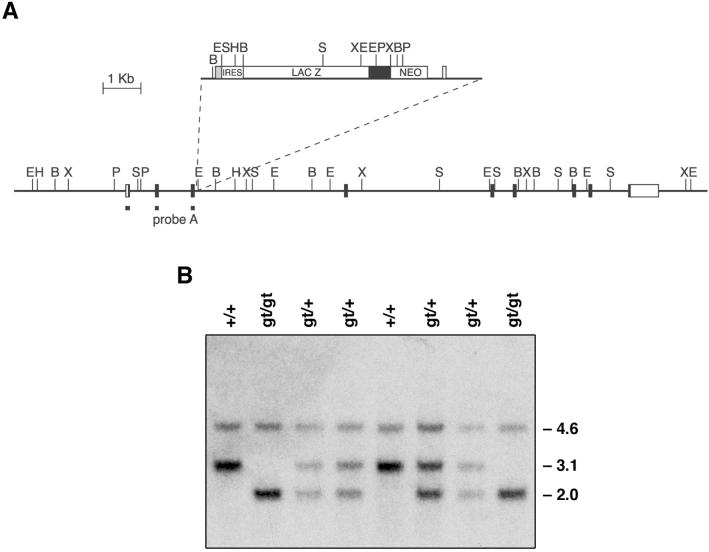
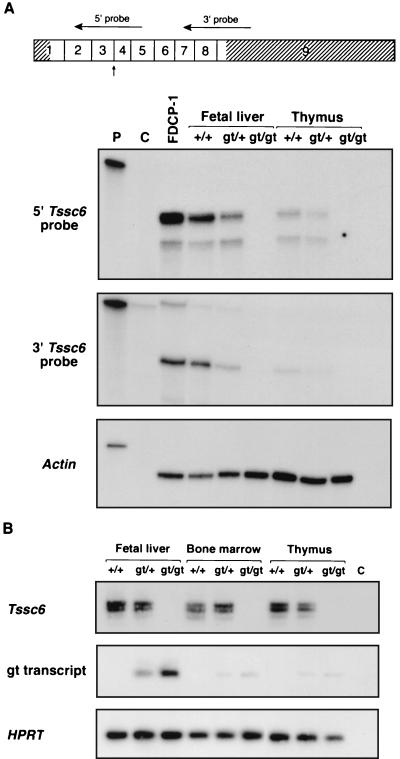
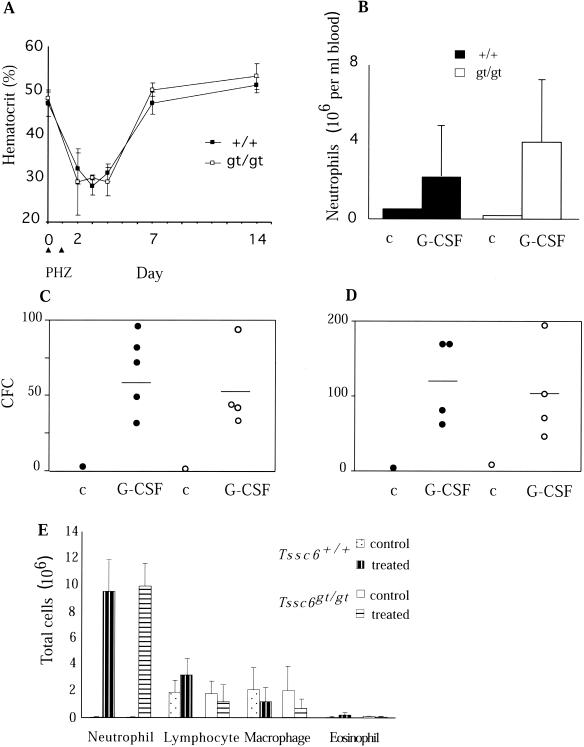
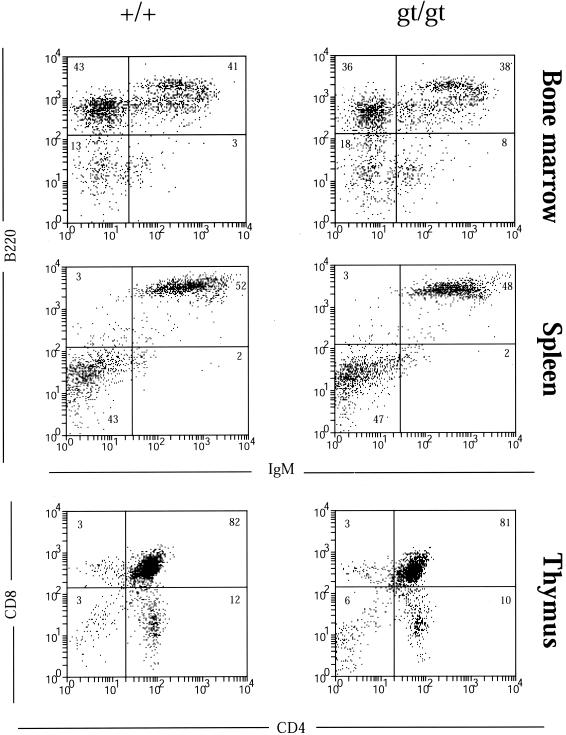
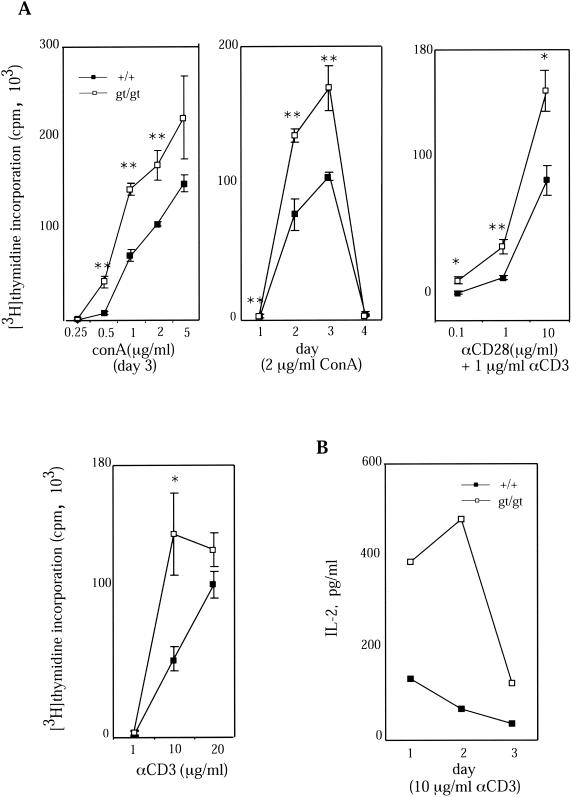
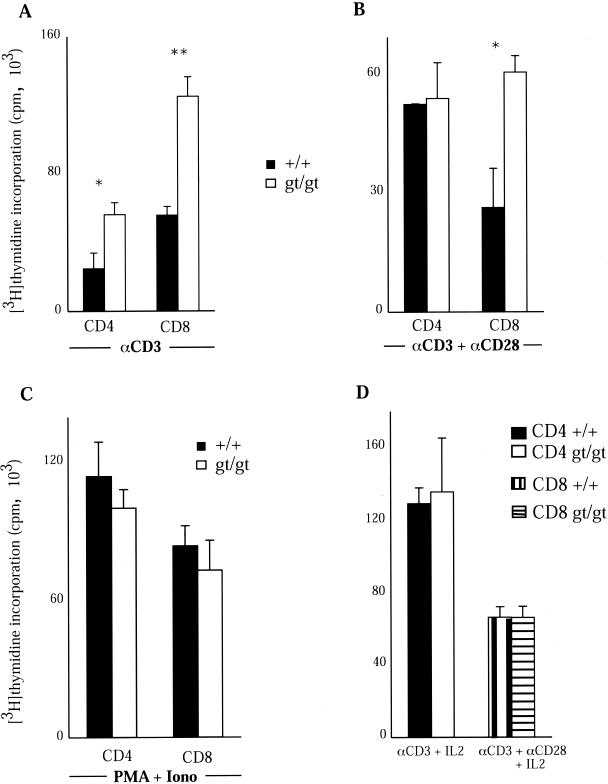
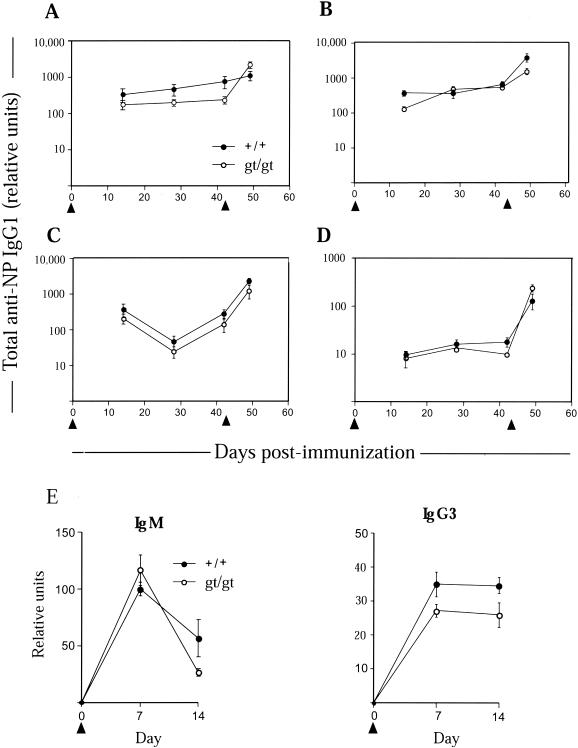
The tetraspanins are a family of integral membrane proteins with four transmembrane domains. These molecules form multimolecular networks on the surfaces of many different cell types. Gene-targeting studies have revealed a role for tetraspanins in B- and T-lymphocyte function. We have isolated and deleted a novel tetraspanin, Tssc6, which is expressed exclusively in hematopoietic and lymphoid organs. Using a gene-trapping strategy, we generated an embryonic stem (ES) cell line with an insertion in the Tssc6 locus. Mice were derived from these ES cells and, using RNase protection and reverse transcription-PCR, we demonstrated that the insertion resulted in a null mutation of the Tssc6 allele. Mice homozygous for the gene trap insertion (Tssc6(gt/gt) mice) were viable and fertile, with normal steady-state hematopoiesis. Furthermore, responses to hemolysis and granulocyte colony-stimulating factor-induced granulopoiesis were equivalent to those of wild-type mice. Lymphoid development was normal in Tssc6(gt/gt) mice. Whereas Tssc6(gt/gt) B cells responded normally to lipopolysaccharide, anti-CD40, and anti-immunoglobulin M stimulation, Tssc6(gt/gt) T cells showed enhanced responses to concanavalin A, anti-CD3, and anti-CD28. This increased proliferation by Tssc6-deleted T lymphocytes was due to increased interleukin 2 production following T-cell receptor stimulation. These results demonstrate that Tssc6 is not required for normal development of the hematopoietic system but may play a role in the negative regulation of peripheral T-lymphocyte proliferation.


Figures

FIG. 1.
FIG. 1.
Mapping of the disruption of the Tssc6 locus by insertion of the gene trap vector pMS-1 and genotyping of Tssc6 mutant mice. (A) The pMS-1 vector, with the vector backbone shown as a line. The site of insertion of the gene trap vector into intron 3 of the Tssc6 genomic locus is indicated. Extensive mapping of the Tssc6 locus upstream and downstream of the insertion site did not reveal any additional rearrangements. Exons are shown as boxes, with coding regions filled. Restriction enzyme sites are indicated as follows: E, EcoRI; H, HindIII; B, BamHI; X, XbaI; P, PstI; S, SacI. (B) Genotyping of Tssc6 mutant mice. A Southern blot of tail DNA digested with SacI was probed with the fragment shown in panel A. The sizes of the endogenous Tssc6 bands (4.6 and 3.1 kb) and the altered Tssc6 allele (2.0 kb) are indicated. Lanes: +/+, wild-type; gt/+, heterozygous for the Tssc6 gene trap insertion; gt/gt, homozygous for the Tssc6 gene trap insertion.
FIG. 2.
FIG. 2.
The gene trap insertion in Tssc6 results in a null allele. (A) RNase protection analysis of RNA prepared from the fetal liver and thymus of Tssc6gt/gt mice and littermates. At the top of the panel, the Tssc6 cDNA is shown, with the nine exons indicated by boxes. The 5′ and 3′ untranslated regions are hatched. Horizontal arrows indicate the position of the 5′ and 3′ riboprobes. The vertical arrow shows the point of fusion with the gene trap vector. With both 5′ and 3′ riboprobes, protected bands in RNA prepared from the fetal liver and thymus of Tssc6+/+ and Tssc6gt/+ mice are shown, but in RNA from Tssc6gt/gt mice, bands are absent. Lanes: P, undigested, full-length probe; C, probe after RNase digestion; FDCP-1, RNA from FDCP-1 cells, which are known to express Tssc6; +/+, wild-type; gt/+, heterozygous for the Tssc6 gene trap insertion; gt/gt, homozygous for the Tssc6 gene trap insertion. (B) RT-PCR to amplify Tssc6 transcripts and gene trap fusion transcripts from the fetal liver, bone marrow, and thymus of Tssc6gt/gt mice and their littermates. The multiple bands amplified with Tssc6 primers were due to alternate splice variants (26). Hypoxanthine phosphoribosyltransferase transcripts were amplified to estimate the amount of cDNA present in each reaction. Lane C, no cDNA control.
FIG. 3.
FIG. 3.
Responses to diverse stimuli resulting in perturbations of steady-state hematopoiesis are unaltered in Tssc6gt/gt mice. (A) Response to PHZ-induced hemolytic anemia in Tssc6gt/gt mice. PHZ was administered i.p. to Tssc6+/+ (+/+) and Tssc6gt/gt (gt/gt) mice on days 1 and 2, and recovery in hematocrit was assessed at the indicated time points. Values represent the means and standard deviations of the cohorts of three mice analyzed at each time point. (B) Mobilization of mature neutrophils and progenitor cells in the peripheral blood and spleens of Tssc6gt/gt mice. Mice were injected subcutaneously with 2.5 μg of G-CSF twice daily for five consecutive days and analyzed on the sixth day. Peripheral blood neutrophil numbers in Tssc6gt/gt and Tssc6+/+ mice treated with G-CSF were compared to those for a sex-, weight-, and genotype-matched, untreated control mouse (c). Means and standard deviations of four treated mice of each genotype are given. (C and D) Spleen and peripheral blood colony-forming cell (CFC) numbers, respectively. Open (Tssc6gt/gt mice) and filled (Tssc6+/+ mice) circles represent the mean CFC number in triplicate cultures of spleen (25,000 cells) and peripheral blood (25 μl) in agar cultures stimulated by SCF, IL-3, and erythropoietin. For treated mice, the bar depicts the mean number of CFCs from four mice. (E) Mobilization of neutrophils to the peritoneal cavity. Tssc6gt/gt and Tssc6+/+ mice were injected i.p. with casein. Three hours later, the mice were killed and the peritoneal exudate was collected and examined. Data represent the means and standard deviations of absolute cell numbers in the exudate from four treated mice and six untreated controls.
FIG. 4.
FIG. 4.
Flow cytometric analysis of lymphocyte populations in Tssc6+/+ (+/+) and Tssc6gt/gt (gt/gt) mice. Lymphocytes were gated by using forward and side scatter properties. Shown are typical profiles obtained from one of five experiments. Percentages of cells positive for each marker are indicated.
FIG. 5.
FIG. 5.
Proliferation of purified T-lymphocyte populations from Tssc6gt/gt mice. (A) T lymphocytes were negatively enriched from the pooled spleens of three mice of each genotype, and 105 cells/well were cultured with surface-adsorbed anti-CD28 and/or anti-CD3. Unseparated splenocytes (105 cells/well) were used for concanavalin A (ConA) stimulation. Proliferative responses of the Tssc6gt/gt (gt/gt) and Tssc6+/+ (+/+) cells for one of at least three comparable experiments are shown. Tritiated thymidine incorporation by unstimulated cells was below 1,000 cpm. Data points symbolize the means for tritiated thymidine incorporation of triplicate wells, and bars represent the standard deviations. ∗, P < 0.05; ∗∗, P < 0.005. (B) Supernatants from T-cell cultures were measured by ELISA for IL-2 secretion following stimulation with 10 μg of anti-CD3/ml. One of two experiments is depicted.
FIG. 6.
FIG. 6.
Proliferation responses of CD4 and CD8 T-cell subsets. T-cell subsets were cultured at a concentration of 105 cells/well and stimulated with either 10 μg of anti-CD3/ml (A), 1 μg of anti-CD3/ml and 10 μg of anti-CD28/ml (B), or 10 ng of PMA/ml and 100 ng of ionomycin (Iono)/ml (C) for 4 days, with the maximal tritiated thymidine incorporation shown. ∗, P < 0.05; ∗∗, P < 0.005. (D) Proliferative response when IL-2 at a concentration of 100 IU/ml was added to CD8 cells stimulated with anti-CD3 and anti-CD28 or CD4 cells stimulated with anti-CD3. Each value represents the mean and standard deviation obtained from triplicate cultures.
FIG. 7.
FIG. 7.
Humoral response of Tssc6gt/gt mice to immunization with T-cell-dependent and T-cell-independent antigens. The T-cell-dependent antigen NP18-KLH was administered i.p. (arrowheads) at the following doses for the primary response. (A) One hundred micrograms of NP18-KLH precipitated in alum. (B) Ten micrograms of NP18-KLH precipitated in alum. (C) One microgram of NP18-KLH precipitated in alum. (D) Twenty micrograms of NP18-KLH without adjuvant. Boosting occurred where indicated by the second arrow. (E) Fifty micrograms of NP-LPS injected i.p. on day 0 into each mouse to generate a T-cell-independent immune response. Anti-NP IgM and IgG3 were measured by ELISA at the indicated time points. Data represent the means and standard errors of the means for six mice (panels A through D) or cohorts of three mice (panel E) of each genotype.

References

    1. Abe, R., P. Vandenberghe, N. Craighead, D. S. Smoot, K. P. Lee, and C. H. June. 1995. Distinct signal transduction in mouse CD4+ and CD8+ splenic T cells after CD28 receptor ligation. J. Immunol. 154:985-997. - PubMed
    1. Cannons, J. L., P. Lau, B. Ghumman, M. A. DeBenedette, H. Yagita, K. Okumura, and T. H. Watts. 2001. 4-1Bb ligand induces cell division, sustains survival, and enhances effector function of CD4 and CD8 T cells with similar efficacy. J. Immunol. 167:1313-1324. - PubMed
    1. Claas, C., C. S. Stipp, and M. E. Hemler. 2001. Evaluation of prototype TM4SF protein complexes and their relation to lipid rafts. J. Biol. Chem. 276:7974-7984. - PubMed
    1. Clay, D., E. Rubinstein, Z. Mishal, A. Anjo, M. Prenant, C. Jasmin, C. Boucheix, and M. C. Le Bousse-Kerdiles. 2001. CD9 and megakaryocyte differentiation. Blood 97:1982-1989. - PubMed
    1. Deeths, M. J., and M. F. Mescher. 1997. B7-1-dependent co-stimulation results in qualitatively and quantitatively different responses by CD4+ and CD8+ T cells. Eur. J. Immunol. 27:598-608. - PubMed

Publication types