Comparative Study
. 2002 Jun 24;157(7):1151-60.
doi: 10.1083/jcb.200108103. Epub 2002 Jun 24.

Transmission of cell stress from endoplasmic reticulum to mitochondria: enhanced expression of Lon protease

Affiliations
Comparative Study

Transmission of cell stress from endoplasmic reticulum to mitochondria: enhanced expression of Lon protease

Osamu Hori et al. J Cell Biol. .

Abstract

The rat homologue of a mitochondrial ATP-dependent protease Lon was cloned from cultured astrocytes exposed to hypoxia. Expression of Lon was enhanced in vitro by hypoxia or ER stress, and in vivo by brain ischemia. These observations suggested that changes in nuclear gene expression (Lon) triggered by ER stress had the potential to impact important mitochondrial processes such as assembly and/or degradation of cytochrome c oxidase (COX). In fact, steady-state levels of nuclear-encoded COX IV and V were reduced, and mitochondrial-encoded subunit II was rapidly degraded under ER stress. Treatment of cells with cycloheximide caused a similar imbalance in the accumulation of COX subunits, and enhanced mRNA for Lon and Yme1, the latter another mitochondrial ATP-dependent protease. Furthermore, induction of Lon or GRP75/mtHSP70 by ER stress was inhibited in PERK (-/-) cells. Transfection studies revealed that overexpression of wild-type or proteolytically inactive Lon promoted assembly of COX II into a COX I-containing complex, and partially prevented mitochondrial dysfunction caused by brefeldin A or hypoxia. These observations demonstrated that suppression of protein synthesis due to ER stress has a complex effect on the synthesis of mitochondrial-associated proteins, both COX subunits and ATP-dependent proteases and/or chaperones contributing to assembly of the COX complex.


Figures
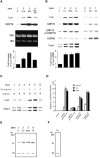
Figure 1.
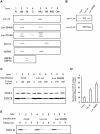
Figure 1.
Expression of Lon in response to cell stress. (A) Expression of Lon and GRP78 mRNA in cultured astrocytes subjected to various stresses for the indicated periods: N, normoxia for 22 h; H16 and H22, hypoxia for 16 and 22 h, respectively; R, hypoxia for 22 h followed by reoxygenation for 4 h. The third (dark) panel shows the ethidium bromide stained gel. Quantification of relative intensities for Lon mRNA was accomplished by laser densitometry, and is shown as fold increase (normoxic controls were arbitrarily assigned a value of 1). The values shown are means ± SD of three experiments. (B) Expression of Lon, GRP78, GRP75/mtHSP70, HSP60, and Yme1 mRNA in HeLa cells subjected to other forms of stress. Tm (2 μg/ml for 16 h); BFA (5 μg/ml for 16 h); Tg (no treatment). (C) Effects of actinomycin D on the expression of Lon and Yme1. HeLa cells were exposed to actinomycin D (AcD; 5 μg/ml) for the indicated times in the presence/absence of tunicamycin (cells were pretreated with the latter for 16 h) and Northern blotting was performed. (D) Relative luciferase activity of Lon promoter–luciferase constructs. Human or mouse Lon promoter, wild-type or mutant GRP78 promoter in the pGL3 basic vector, or pGL3basic vector alone was transfected with pRL-SV40 into HeLa cells. Relative luciferase activity was measured as described in the text. (E) Expression of Lon protein in response to ER stress. HeLa cells were treated with Tm, BFA, or Tg as described above, and Western blotting was performed with anti-Lon antibody 665. Migration of simultaneously run molecular weight standards is indicated on the far left in kD. (F) Competition of Lon antigen with a 100-fold excess of the synthetic Lon peptide was examined using cell extracts from HeLa cells treated with Tm as described above.
Figure 2.
Figure 2.
Expression of Lon in the ischemic rat brain. (A) Total RNA (10 μg) from rat brains after MCA occlusion (8 h; I, ischemia) or sham operation (8 h; C, control) was subjected to Northern blotting (top). The bottom panel shows the ethidium bromide stained gel. (B) Brain slices after MCA occlusion (8 h) were studied by in situ hybridization with riboprobes derived from the Lon cDNA. Bar, 200 μm. (C) Expression of Lon antigen after MCA occlusion. Brains homogenates (50 μg protein) after MCA operation (8 h, I) or sham operation (8 h, C) were subjected to Western blotting with anti-Lon antibody 665. Migration of simultaneously run molecular weight standards is indicated on the far left in kD.
Figure 3.
Figure 3.
Effects of ER stress on the expression of COX subunits. (A) HeLa cells were treated with Tm, BFA, Tg, or cultured in medium alone (C) for 16 h as described in the legend for Fig. 1. Western blotting was then performed with antibodies against COX I, II, IV, V, or KDEL. Sites of primary antibody binding were identified using alkaline phosphatase-conjugated secondary antibodies. (B) Quantification of band intensities in A was accomplished by laser densitometry. Percent band intensities under ER stress (A, lanes 2–4) compared with control (A, lane1) are shown. The values shown are means ± SD of three experiments. (C) Time course of changes in COX subunit expression in response to Tm treatment. Western blotting was performed as described in A. (D) Turnover of COX subunits under ER stress. Pulse-chase analysis was performed using HeLa cells in the presence of Tm (16 h pretreatment with Tm) or in medium alone, as described in the text, and immunoprecipitation was performed with the indicated antibodies followed by autoradiography. (E) Effects of Tm treatment (16 h) on the trypsin sensitivity of COX I and II. Mitochondria were isolated as described in the text and protein extracts were incubated with the indicated concentration of trypsin for 30 min on ice. Western blotting was then performed and sites of primary antibody binding were determined by the ECL method.
Figure 4.
Figure 4.
The effects of suppression of protein synthesis on expression of COX subunits and Lon. (A) Western blotting was performed as described in Fig. 3 A after exposure of HeLa cells to cycloheximide for 4 h (lanes 1–3) or 8 h (lanes 4–6). (B) Turnover of COX subunits in the presence of cycloheximide. Pulse-chase analysis was performed with HeLa cells exposed to cycloheximide (4 h pretreatment with cycloheximide) or in medium alone. Immunoprecipitation was then performed as described in the legend to Fig. 3 D. (C) Expression of Lon, Yme1, and GRP78 in the presence of cycloheximide. Northern blotting was performed using total RNA (10 μg) from HeLa cells exposed to cycloheximide (2 μg/ml) for the indicated times. (D) Requirement of PERK for the expression of Lon and GRP75/mtHSP75. Northern blotting was performed with total RNA from wild-type or PERK(−/−) mouse embryonic fibroblasts after treating cells with Tm or Tg for the indicated times. The bottom panel shows the amounts of β-actin transcript as a control.
Figure 5.
Figure 5.
The effects of transient overexpression of Lon on the assembly and degradation of COX II. (A) Expression and localization of ectopically expressed Lon antigens. Each construct (wild-type, S845N, or K519N Lon) was inserted in pME18Sf+/hygro and transfected into 293T cells. Cultures were harvested after 48 h, and crude and submitochondrial fractions were obtained as described in the text. Western blotting was then performed with anti-FLAG (for ectopically expressed Lon), anti-COX II, anti-HSP60, or anti-KDEL antibodies. C, cytosol; IM, inner membrane; IMS, inter-membrane space; M, microsome; Mt, mitochondria; Mtx, matrix; N, nucleus; and OM, outer membrane. (B) Detection of endogenous and ectopically expressed Lon antigens. Western blotting using whole-cell lysates from mock, wild-type, or S845N- transfected 293T cells was performed with anti-FLAG antibody. (C) Trypsin sensitivity of COX I and II in the presence of tunicamycin was assessed as described in Fig. 3 E. (D) Quantification of band intensities in (B) was accomplished by laser densitometry. Levels/intensities of COX II antigen after digestion with trypsin (250 μg/ml) are shown as percentage intensity versus COX II antigen in the absence of trypsin. The values shown are means ± SD of three experiments. (E) Turnover of COX II in the presence of tunicamycin. Pulse-chase analysis was performed with 293T cells overexpressing Lon in the presence of tunicamycin (pretreatment with Tm for 16 h) followed by immunoprecipitation with anti-COX II antibody.
Figure 6.
Figure 6.
The effects of stable overexpression of Lon on the assembly of COX II. (A) Expression of wild-type or S845N Lon by stably transfected HeLa cells. Western blotting was performed with anti-Lon 665 or anti-FLAG antibody. (B) Trypsin sensitivity of COX II in the presence of Tm was assessed in stably transfected HeLa cells as described in Fig. 3 E. (C) Quantification of band intensities in (B) was accomplished by laser densitometry. Levels/intensities of COX II antigen after digestion with trypsin (250 μg/ml) are shown as the percentage of intensity versus COX II antigen in the absence of trypsin. The values shown are means ± SD of three experiments. (D) Detection of COX II bound to COX I and total COX II antigen was performed by immunoprecipitation (IP) with the indicated antibodies followed by Western blotting (Blot) with anti-COX II antibody. (E) Percentage of COX II bound to COX I. The values shown are means ± SD of three experiments.
Figure 7.
Figure 7.
Effects of Lon overexpression on mitochondrial dysfunction caused by BFA treatment or hypoxia. (A) Lon S845–1 (IV, V, and IV) or mock-transfected cells (I, II, and III) were treated with BFA for 16 h (II and V), exposed to hypoxia for 48 h (III and VI), or cultured under normoxia (I and III). Mitochondrial membrane potential was studied microscopically after treating cells with MitosensorTM for 15 min. Bar, 15 μm. (B) The numbers of cells that showed signals derived from mitochondrial membrane potential were counted and indicated as the percentage of the total cell population. The values shown are means ± SD of three experiments. *P < 0.01.

Similar articles

Cited by

References

    1. Amerik, A.Y., G.V. Petukhova, V.G. Grigorenko, I.P. Lykov, S.V. Yarovoi, V.M. Lipkin, and A.E. Gorbalenya. 1994. Cloning and sequence analysis of cDNA for a human homologue of eubacterial ATP-dependent Lon proteases. FEBS Lett. 340:25–28. - PubMed
    1. Casari, G., M. De Fusco, S. Ciarmatori, M. Zeviani, M. Mora, P. Fernandez, G. De Michele, A. Filla, S. Cocozza, R. Marconi, A. Dürr, B. Fontaine, and A. Ballabio. 1998. Spastic paraplegia and OXPHOS impairment caused by mutation in paraplegin, a nuclear-encoded mitochondrial metalloprotease. Cell. 93:973–983. - PubMed
    1. Dowhan, W., C.R. Bibus, and G. Schatz. 1985. The cytoplasmically-made subunit IV is necessary for assembly of cytochrome c oxidase in yeast. EMBO J. 4:179–184. - PMC - PubMed
    1. Evans, W.H., 1992. Preparative Centrifugation. A Practical Approach. Rickwood, D., editor. Oxford University Press, Oxford, UK. 399 pp.
    1. Kobara, M., T. Tatsumi, S. Matoba, Y. Yamahara, C. Nakagawa, B. Ohta, T. Matumoto, D. Inoue, J. Asayama, and M. Nakagawa. 1996. Effect of ischemic preconditioning on mitochondrial oxidative phosphorylation and high energy phosphates in rat hearts. J. Mol. Cell. Cardiol. 28:417–428. - PubMed

Publication types

MeSH terms