Comparative Study
. 2002 Jun 24;157(7):1187-96.
doi: 10.1083/jcb.200201048. Epub 2002 Jun 24.

MAP2 and tau bind longitudinally along the outer ridges of microtubule protofilaments

Affiliations
Comparative Study

MAP2 and tau bind longitudinally along the outer ridges of microtubule protofilaments

Jawdat Al-Bassam et al. J Cell Biol. .

Abstract

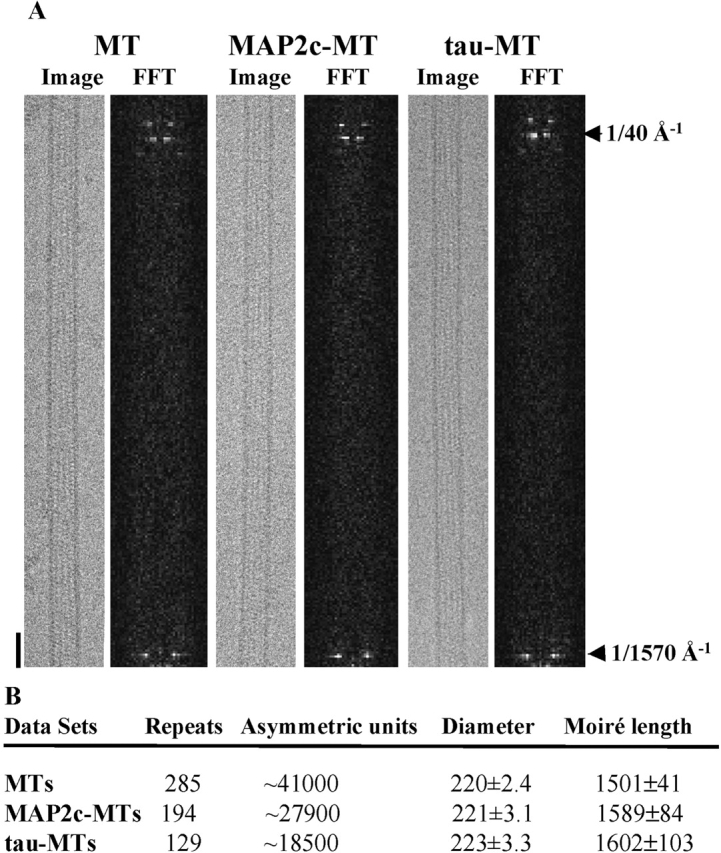
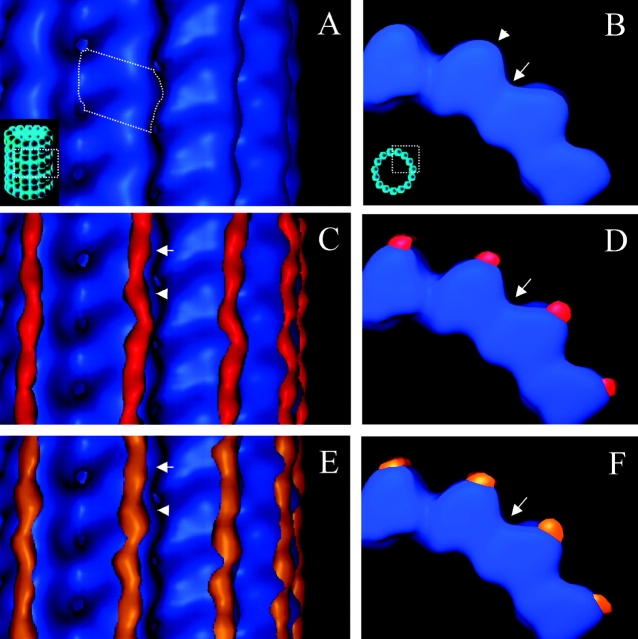
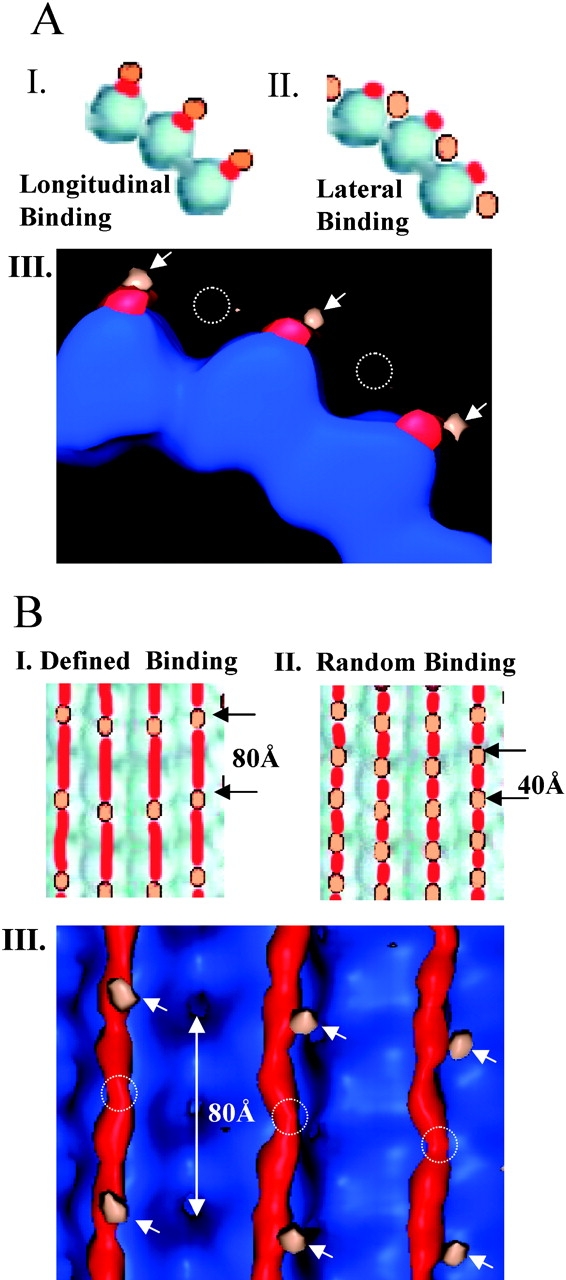
MAP2 and tau exhibit microtubule-stabilizing activities that are implicated in the development and maintenance of neuronal axons and dendrites. The proteins share a homologous COOH-terminal domain, composed of three or four microtubule binding repeats separated by inter-repeats (IRs). To investigate how MAP2 and tau stabilize microtubules, we calculated 3D maps of microtubules fully decorated with MAP2c or tau using cryo-EM and helical image analysis. Comparing these maps with an undecorated microtubule map revealed additional densities along protofilament ridges on the microtubule exterior, indicating that MAP2c and tau form an ordered structure when they bind microtubules. Localization of undecagold attached to the second IR of MAP2c showed that IRs also lie along the ridges, not between protofilaments. The densities attributable to the microtubule-associated proteins lie in close proximity to helices 11 and 12 and the COOH terminus of tubulin. Our data further suggest that the evolutionarily maintained differences observed in the repeat domain may be important for the specific targeting of different repeats to either alpha or beta tubulin. These results provide strong evidence suggesting that MAP2c and tau stabilize microtubules by binding along individual protofilaments, possibly by bridging the tubulin interfaces.


Figures

Figure 1.
Figure 1.
Sequence homology and binding stoichiometry of MAP2c/tau. (A) MTBRs and IRs of MAP2/tau have higher homology across species than with neighboring MTBRs and IRs. We performed MAP2/tau sequence alignment using Clustal W (Aiyar, 2000) with human (Hs), mouse (Mm), and rat (Rn) sequences of three-repeat MAP2c and four-repeat tau genes (GenBank/EMBL/DDBJ accession nos.: NP_114033 for Hs MAP2c; NP_005901 for Hs tau; AAA39490 for Mm MAP2c [extracted from MAP2b gene based upon consensus splice sites]; AAA58343 for Mm tau; CAA35667 for Rn MAP2c; NP_058908 for Rn tau). Above the aligned sequences, we show a schematic diagram of MTBRs (labeled R1–R4) and IRs. IRs are labeled according to the designation of the repeats that precede and follow them (e.g., the IR between repeats 3 and 4 is designated “IR-3/4”). Positively charged residues (shaded in gray) and negatively charged residues (shaded in black) are highly conserved at identical positions of the repeat domains. Based upon residue conservation, IR-3/4 modules are quite different from IR-1/2 or IR-2/3 modules. In four-repeat tau, alternative splicing introduces an additional MTBR-IR module (R2 and IR-2/3, upper left) that is very similar to R1 and IR-1/2 modules (for ease of sequence comparison, we depict the added module as shown, actual splice boundaries differ; see Goode and Feinstein, 1994, for details). The comparisons suggests that R2, IR-2/3 modules have higher homology to R1, IR-1/2 modules than to R3, IR-3/4 modules, respectively. The asterisk identifies Lys-364 in IR-3/4 where the undecagold was attached. (B) MAP2c and tau bind microtubules with different stoichiometries. MAP2c binding to microtubules is measured by cosedimentation with microtubules in the pellet (P) and depletion from the supernatant (S). In I, MAP2c does not sediment in the absence of microtubules (0:1). Each MAP2c binds 2.4 tubulin monomers. Saturation is indicated by MAP2c remaining in the supernatant (S lanes) at the 3:1 ratio compared with the 6:1 ratio. In II, cosedimentation assays indicate that tau saturates microtubules at one molecule of tau to 3.8 tubulin monomers. At the saturating ratio of tubulin to tau (4:1), the supernatant (S) contains unbound tau compared with the lower ratio (8:1) where all tau is bound to microtubules.
Figure 2.
Figure 2.
The binding of MAPs to microtubules does not induce changes to their architecture. (A) Images and power spectra (FFT) of MAP2c-decorated microtubules (MAP2c-MT), tau-decorated microtubules (tau-MT), and undecorated microtubules (MT) are visually indistinguishable. Only one half of each power spectrum (FFT) is shown and it is compressed 16-fold in the equatorial direction. Bar, 300 Å. (B) Number of moiré repeats and asymmetric units contributing to the final data are listed together with average microtubule diameter and average moiré length (in angstroms) for each dataset.
Figure 3.
Figure 3.
MAP2c and tau form ordered densities protofilament ridges. (A) En face view of the undecorated microtubule map showing four protofilaments. A tubulin monomer is outlined by a dotted line. (B) View of the undecorated microtubule map from the minus end showing the smooth curvature of protofilament ridges (arrowhead) separated by valleys between protofilaments (arrow). (C and E) En face views of MAP2c (red) and tau (orange) difference maps displayed with the microtubule map (blue). Arrows and arrowheads indicate two different density peaks in the elongated difference map associated with each 40-Å longitudinal repeat of tubulin. (D and F) Views of C and E from the microtubule minus end showing the slender profile of MAP2c and tau densities compared with tubulin. No difference densities are seen in the valleys between protofilaments (arrows).
Figure 4.
Figure 4.
Neither Cys mutagenesis nor Au11–IR-3/4 labeling of MAP2c interfere with overall microtubule binding. (A) Examples of cosedimentation analysis of cf-MAP2c and microtubules. Each cf-MAP2c binds 2.8 tubulin monomers at saturation, and it only pellets in the presence of microtubules. Supernatants (S) and pellets (P) at molar ratios of 0:1, 3:1, or 6:1 (tubulin/MAP2c) are shown. (B) Each unlabeled cIR-MAP2c (−Au11) bound 2.6 tubulin monomers and each gold-labeled cIR-MAP2c (+Au11) bound 2.5 tubulin monomers.
Figure 5.
Figure 5.
Longitudinal binding of MAP2c along protofilaments. (A) MAP2c binds longitudinally along single protofilaments and not laterally across multiple protofilaments. The two possible models would result in different localizations of Au11 attached to IR-3/4. In I, the longitudinal binding model would result in the Au11 lying on top of the protofilament ridges. In II, the lateral binding model would lead to Au11 lying in the valleys between protofilaments. In III, a view from the minus end shows that the Au11 difference map (tan) is only present on top of the MAP2c difference densities (red). This result supports the longitudinal binding model (arrows) and excludes the lateral binding model (broken circles). (B) Averaging during image analysis leads to outcomes that suggest specific targeting to α or β tubulin. If specific targeting occurs, the Au11 attached to IR-3/4 will only be visualized when the data is averaged assuming an 80-Å tubulin repeat (I). With nonspecific (i.e., random) binding of MAP2c repeats, averaging assuming either 40- or 80-Å repeats will result in visualization of the Au11 every 40 Å (II). Both specific and random binding modes occur at the same saturation stoichiometry. In III, an en face view of A III is shown. The difference peaks attributable to Au11 (tan, arrows) were only visualized when the data were averaged taking into account 80-Å tubulin heterodimer periodicity. This result suggests specific targeting of the MTBR-IRs to either to α or β tubulin. Dotted circles signify the absence of difference peaks that would be expected if random binding occurred.
Figure 6.
Figure 6.
MAP2c lies over H11, H12, and COOH termini of tubulin along the protofilament ridges. (A) View from the minus end of the protofilament structure (Protein Data Bank identification no. 1TUB) docked into the microtubule map (blue wire frame). Tubulin H11 and H12 (yellow) are on the external protofilament ridges and appear to be the primary binding sites for the MAP2c difference map (enclosed by dotted red lines). The tubulin COOH termini (orange, modeled in arbitrary conformations) extend into the MAP2c difference map. Other helices and sheets in the tubulin structure are blue and green, respectively. (B and C) En face and side views (respectively) showing that the undecagold difference map (Au11) and, hence, IR-3/4 lie close to the tubulin–tubulin interface (dashed white lines) and are associated with one of the high-density peaks in the MAP2c difference map (red). The IR lies over the COOH-terminal part of H11. The second density peak of the MAP2c difference map lies over the end of H12 and the exit site of the tubulin COOH terminus. It is attributable to the MTBR and the tubulin COOH terminus (red dotted lines).
Figure 7.
Figure 7.
Model for MAP2c repeat domain binding to protofilaments. The MAP2c repeat domain (three repeats shown as an ∼280-Å-long strand) and the tubulin COOH termini (red, in arbitrary conformation) are unstructured as shown in I (the protofilament illustration is reproduced from The Journal of Cell Biology, 2000; 151, 1093–1110 by copyright permission of the Rockefeller University Press). During binding, the MAP2c repeat domain interacts with the tubulin COOH termini, becomes compacted, and localizes on the outer surface of the protofilament. A combination of two binding geometries (II and III) is required to explain both the observed binding stoichiometry and the gold labeling data showing specific targeting of repeats to either α or β tubulin. In II, all three repeats of MAP2c are specifically bound to a protofilament and there are gaps (one unbound tubulin monomer) between adjacent MAP2c molecules. In III, only two of the MAP2c repeats are bound and there are no gaps along the protofilament. The central repeat of MAP2c (blue stripes) has the highest affinity (Coffey et al., 1994; Ludin et al., 1996). In both binding geometries, the repeat domain has a specific orientation with respect to the tubulin dimer and the IRs bridge the tubulin interfaces. The MAP2c projection domain is not represented here, and the polarity of the repeat domain is not known.

Similar articles

Cited by

References

    1. Aiyar, A. 2000. The use of CLUSTAL W and CLUSTAL X for multiple sequence alignment. Methods Mol. Biol. 132:221–241. - PubMed
    1. Amos, L.A. 1977. Arrangement of high molecular weight–associated proteins on purified mammalian brain microtubules. J. Cell Biol. 72:642–654. - PMC - PubMed
    1. Butner, K.A., and M.W. Kirschner. 1991. Tau protein binds to microtubules through a flexible array of distributed weak sites. J. Cell Biol. 115:717–730. - PMC - PubMed
    1. Carragher, B.O., M. Whittaker, and R.A. Milligan. 1996. Helical processing using PHOELIX. J. Struct. Biol. 116:107–112. - PubMed
    1. Chau, M.F., M.J. Radeke, C. de Ines, I. Barasoain, L.A. Kohlstaedt, and S.C. Feinstein. 1998. The microtubule-associated protein tau cross-links to two distinct sites on each alpha and beta tubulin monomer via separate domains. Biochemistry. 37:17692–17703. - PubMed

Publication types

MeSH terms