. 2002 Jul 9;99(14):9207-12.
doi: 10.1073/pnas.132630999. Epub 2002 Jun 24.

Apparent role of traveling metabolic waves in oxidant release by living neutrophils

Affiliations

Apparent role of traveling metabolic waves in oxidant release by living neutrophils

Andrei L Kindzelskii et al. Proc Natl Acad Sci U S A. .

Retraction in

Abstract

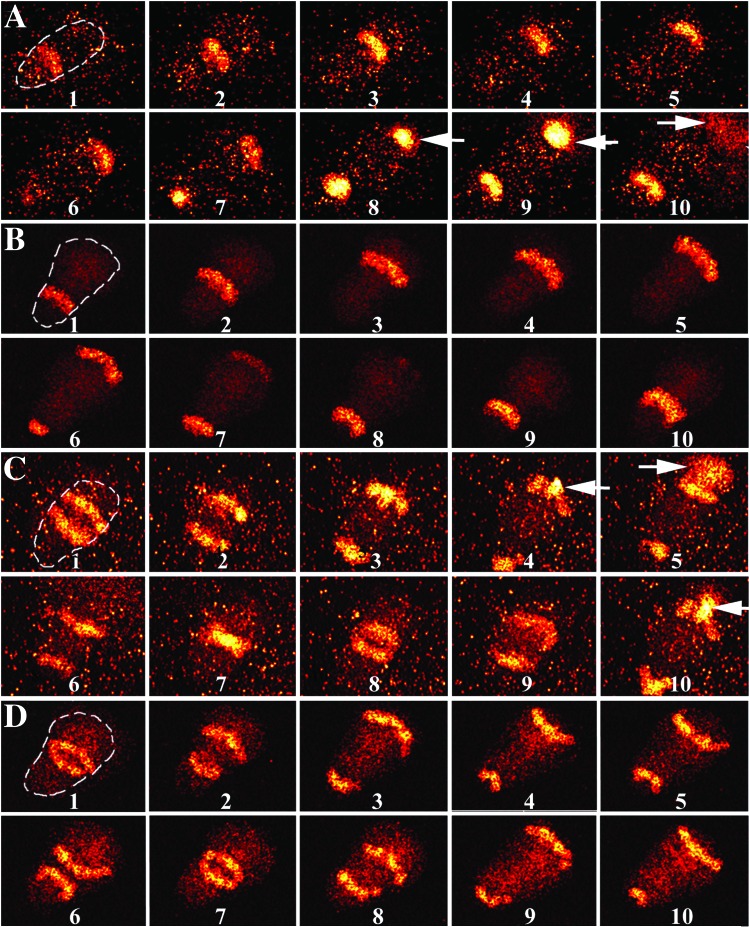
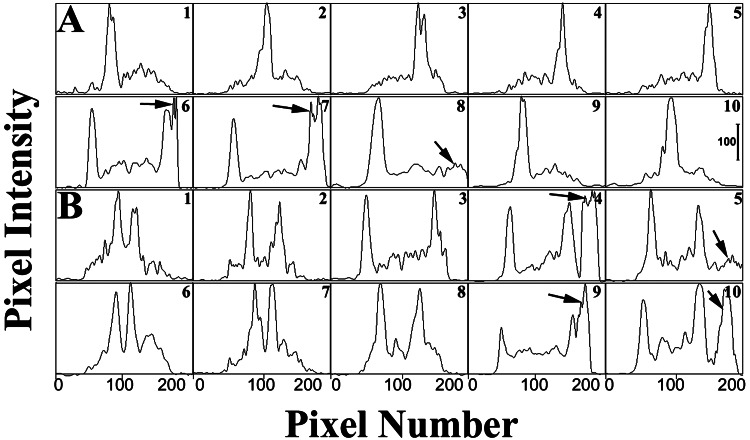
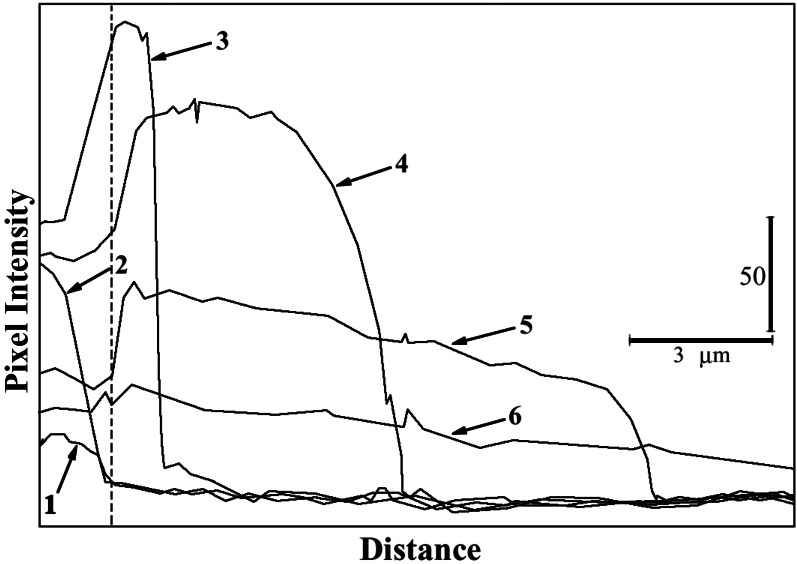
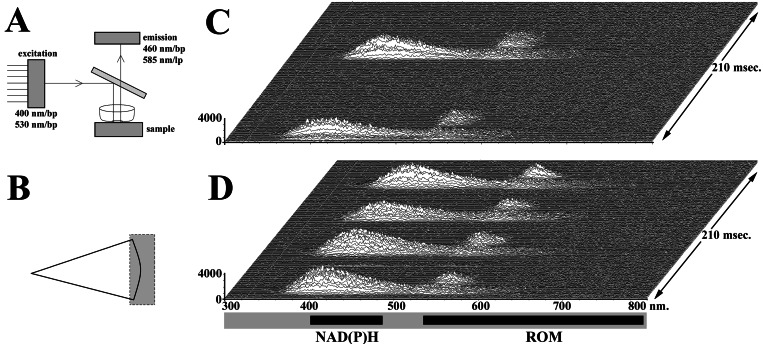
Cell metabolism self-organizes into two types of dissipative structures: chemical oscillations and traveling metabolic waves. In the present study we test the hypothesis that traveling NAD(P)H waves within neutrophils are associated spatially and temporally with the release of reactive oxygen metabolites (ROMs). Using high-speed optical microscopy and taking advantage of the autofluorescence of NAD(P)H, we have observed the propagation of NAD(P)H waves within cells. When NAD(P)H waves reach the lamellipodium of morphologically polarized neutrophils, a diffusing plume of superoxide is released as evidenced by the conversion of hydroethidine in the extracellular environment to ethidium bromide. Parallel results were obtained by using high-speed emission microspectrophotometry. These experiments indicate that the spatial and temporal properties of NAD(P)H waves are transformed into ROM pulses in the extracellular environment. Propagating NAD(P)H waves allow neutrophils to specifically deliver substrate to the lamellipodium at high concentrations, thus facilitating the local and periodic release of ROMs in the direction of cell movement and/or a target.


Figures

Figure 1
Figure 1
Representative fluorescence images of polarized human neutrophils at 37°C using high-speed microscopy. HE was added to the medium to detect superoxide release from cells. Optical filters allowed simultaneous observation of NAD(P)H autofluorescence and EB emission. Each image was collected for 100 nsec with a 25-msec interval between frames. For clarity, the locations of the cells are outlined in the first frames of sequences AD. (A) A time series of fluorescence micrographs of a neutrophil is shown. Fluorescent stripes propagate from the cell's uropod to the lamellipodium. Just after NAD(P)H reaches the lamellipodium (frame 7), a plume of fluorescence caused by the oxidation of HE to EB diffuses into the medium (n = 6, where n = number of days on which the findings were reproduced). (B) This experiment was performed in a fashion identical to that of A except that 500 units/ml SOD was added to the extracellular environment to reduce extracellular superoxide levels. Fluorescent plumes are not observed (for example, see frames 5–7), which suggests that superoxide is necessary for the formation of EB plumes (n = 4). (C) FMLP stimulation leads to two propagating NAD(P)H waves. Fluorescent plumes are found for all NAD(P)H waves (frames 4, 5, and 10; arrows). (D) This experiment was performed in a fashion identical to that of C except that 500 units/ml SOD was added to the extracellular environment. Fluorescent plumes are not observed (for example, see frames 3 and 9 for two NAD(P)H waves at the lamellipodium) (n = 4). The background fluorescence is somewhat higher in A and C because of EB formation before acquiring these data from these and other cells on the microscope slide (×980).
Figure 2
Figure 2
Quantitative line profile analyses of fluorescence images of neutrophils in the presence of HE as described for Fig. 1. Line profiles of an untreated polarized neutrophil (A) and FMLP-stimulated cell (B) are shown. Each panel shows 10 traces at sequential time points as pixel intensity (0–255 gray levels) vs. pixel number. The intensity of each point was determined by summing the intensities for all pixels in a row (the pixel rows were perpendicular to the direction of cell orientation). The data were obtained from micrographs collected for 0.1 μsec. Each panel is separated by 25 msec. EB formation is observed in both A and B (see arrows). Two traveling NAD(P)H waves are observed in B. (Bar = 100 gray levels.)
Figure 3
Figure 3
Quantitative line profile analyses of EB release from polarized neutrophils. Cells were suspended in Hanks' balanced salt solution containing 5 μM HE. Images were collected for 0.1 μsec with an 8-msec delay between each frame. Each frame then was analyzed in a region 1-μm wide extending from the lamellipodium to 15 μm into the extracellular environment. The position of the lamellipodium is indicated by the dashed line. The extracellular environment is to the right hand side of this line. The data are plotted as intensity (gray level) vs. position. The vertical bar indicates 50 gray levels, and the horizontal bar shows a distance of 3 μm. The time-dependent relaxation of the EB gradient in the extracellular environment is shown.
Figure 4
Figure 4
High-speed microspectrophotometry experiments were performed to evaluate NAD(P)H autofluorescence and ROM production. (A) To evaluate simultaneously probes exhibiting different excitation and emission characteristics, multipass optical elements were used. The excitation filter passed bands near 400 and 530 nm, which were reflected by the dichroic mirror. The dichroic mirror transmitted light in the region of 460 and 585 nm, which were passed by the emission filter. (B) The region of the cell and environment selected for study is indicated. (C) A temporal series of emission spectra from a cell is shown. Spectra were collected for 2 msec with 0.1 msec between spectra. Wavelength (nm) is listed along the abscissa, and intensity (counts) is given at the ordinate. Time is the third dimension of the stack, as shown on the right side. Thus, ROMs are observed near the lamellipodium after NAD(P)H arrival. (D) Emission spectra of an FMLP-activated neutrophil indicate increased ROM production (n = 44).

Comment in

References

    1. Schroedinger E. What is Life? Cambridge, U.K.: Cambridge Univ. Press; 1944.
    1. Nicolis G, Prigogine I. Exploring Complexity. New York: Freeman; 1989.
    1. Goldbeter A. Biochemical Oscillations and Cellular Rhythms. Cambridge, U.K.: Cambridge Univ. Press; 1996.
    1. Marmillot P, Hervagault J-F, Welch G R. Proc Natl Acad Sci USA. 1992;89:12103–12107. - PMC - PubMed
    1. Glansdorff P, Prigogine I. Thermodynamic Theory of Structure, Stability, and Fluctuations. New York: Wiley Interscience; 1971.

Publication types