

The aging baboon: comparative demography in a non-human primate
- PMID: 12082185
- PMCID: PMC123185
- DOI: 10.1073/pnas.142675599
The aging baboon: comparative demography in a non-human primate
Abstract
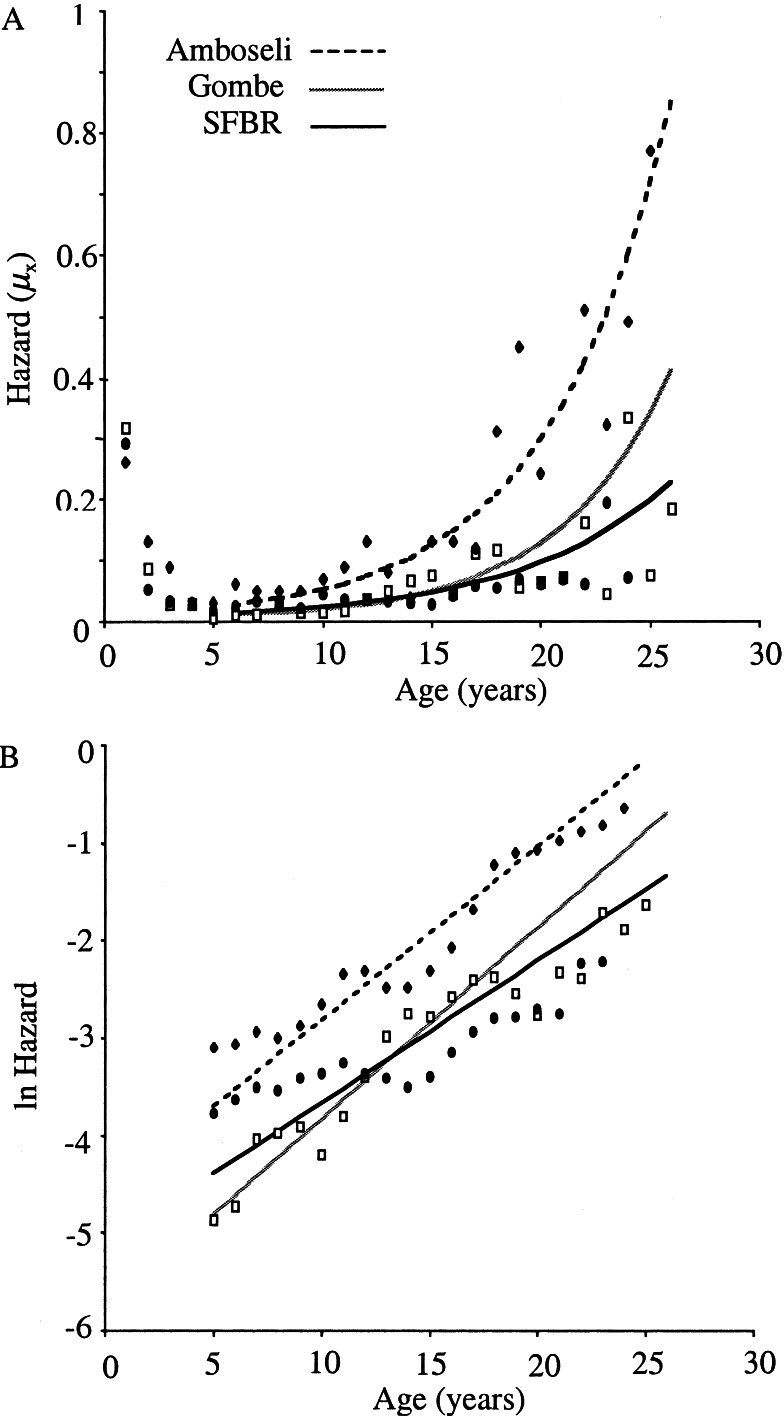
Why do closely related primate genera vary in longevity, and what does this teach us about human aging? Life tables of female baboons (Papio hamadryas) in two wild populations of East Africa and in a large captive population in San Antonio, Texas, provide striking similarities and contrasts to human mortality patterns. For captive baboons at the Southwest Foundation for Biomedical Research, we estimate the doubling time of adult mortality rate as 4.8 years. Wild females in free-living populations in Tanzania and in Kenya showed doubling times of 3.5 and 3.8 years, respectively. Although these values are considerably faster than the estimates of 7-8 years for humans, these primates share a demographic feature of human aging: within each taxon populations primarily vary in the level of Gompertz mortality intercept (frailty) and vary little in the demographic rate of aging. Environmental and genetic factors within taxa appear to affect the level of frailty underlying senescence. In contrast, primate taxa are differentiated by rates of demographic aging, even if they cannot be characterized by species-specific lifespan.
Figures
References
Publication types
MeSH terms
Grants and funding
LinkOut - more resources
Full Text Sources
Medical
