

Control of oral closure in lingual stop consonant production
- PMID: 12083216
- PMCID: PMC2827774
- DOI: 10.1121/1.1473636
Control of oral closure in lingual stop consonant production
Abstract
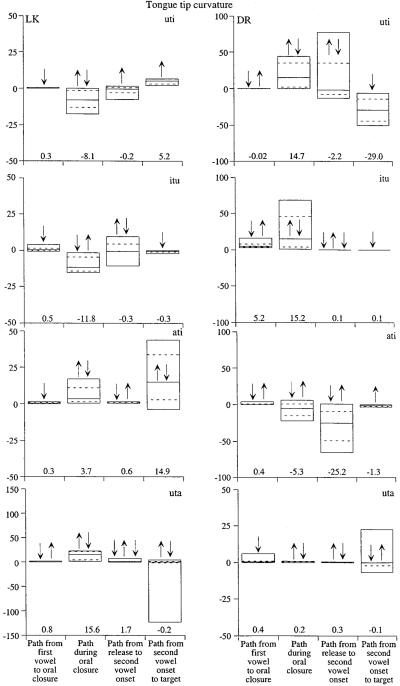
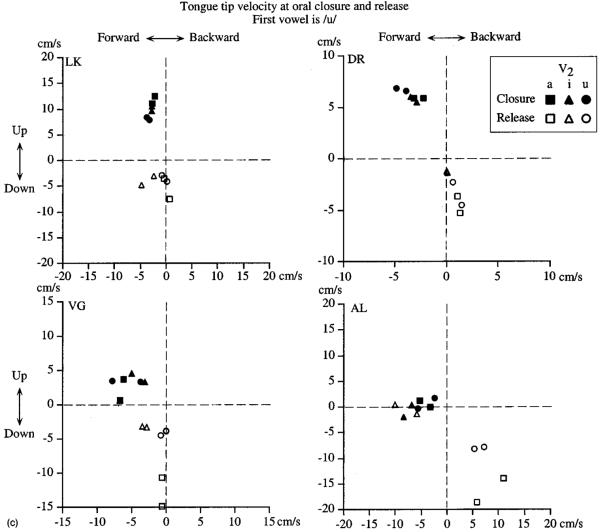
Previous work has shown that the lips are moving at a high velocity when the oral closure occurs for bilabial stop consonants, resulting in tissue compression and mechanical interactions between the lips. The present experiment recorded tongue movements in four subjects during the production of velar and alveolar stop consonants to examine kinematic events before, during, and after the stop closure. The results show that, similar to the lips, the tongue is often moving at a high velocity at the onset of closure. The tongue movements were more complex, with both horizontal and vertical components. Movement velocity at closure and release were influenced by both the preceding and the following vowel. During the period of oral closure, the tongue moved through a trajectory of usually less than 1 cm; again, the magnitude of the movement was context dependent. Overall, the tongue moved in forward-backward curved paths. The results are compatible with the idea that the tongue is free to move during the closure as long as an airtight seal is maintained. A new interpretation of the curved movement paths of the tongue in speech is also proposed. This interpretation is based on the principle of cost minimization that has been successfully applied in the study of hand movements in reaching.
Figures


Similar articles
-
Interarticulator programming: effects of closure duration on lip and tongue coordination in Japanese.J Acoust Soc Am. 2006 Nov;120(5 Pt 1):2872-83. doi: 10.1121/1.2345832. J Acoust Soc Am. 2006. PMID: 17139745 Free PMC article.
-
Influences of tongue biomechanics on speech movements during the production of velar stop consonants: a modeling study.J Acoust Soc Am. 2003 Sep;114(3):1582-99. doi: 10.1121/1.1587737. J Acoust Soc Am. 2003. PMID: 14514212
-
Interarticulator programming in VCV sequences: lip and tongue movements.J Acoust Soc Am. 1999 Mar;105(3):1864-76. doi: 10.1121/1.426723. J Acoust Soc Am. 1999. PMID: 10089609 Free PMC article.
-
Fronted velars, palatalized velars, and palatals.Phonetica. 1993;50(2):73-101. doi: 10.1159/000261928. Phonetica. 1993. PMID: 8316582 Review.
-
[The function of the tongue, lip and cheek in the light of experimental studies].Fortschr Kieferorthop. 1966;27(3):327-37. doi: 10.1007/BF02198661. Fortschr Kieferorthop. 1966. PMID: 4861396 Review. German. No abstract available.
Cited by
-
Vowel-related tongue movements in speech: straight or curved paths? (L).J Acoust Soc Am. 2011 Mar;129(3):1149-52. doi: 10.1121/1.3533722. J Acoust Soc Am. 2011. PMID: 21428476 Free PMC article.
-
Explaining Coronal Reduction: Prosodic Structure and Articulatory Posture.Phonetica. 2018;75(2):151-181. doi: 10.1159/000481099. Epub 2018 Feb 8. Phonetica. 2018. PMID: 29433121 Free PMC article.
-
Interarticulator phasing, locus equations, and degree of coarticulation.J Acoust Soc Am. 1999 Oct;106(4 Pt 1):2022-30. doi: 10.1121/1.427948. J Acoust Soc Am. 1999. PMID: 10530025 Free PMC article.
-
Lip kinematics in long and short stop and fricative consonants.J Acoust Soc Am. 2005 Feb;117(2):858-78. doi: 10.1121/1.1840531. J Acoust Soc Am. 2005. PMID: 15759706 Free PMC article.
-
Estimating feedforward vs. feedback control of speech production through kinematic analyses of unperturbed articulatory movements.Front Hum Neurosci. 2014 Nov 11;8:911. doi: 10.3389/fnhum.2014.00911. eCollection 2014. Front Hum Neurosci. 2014. PMID: 25426056 Free PMC article.
References
-
- Coker C. A model of articulatory dynamics and control. IEEE Trans. Acoust., Speech, Signal Process. 1976;64:452–460.
-
- Crystal T, House A. The duration of American English stops: An overview. J. Phonetics. 1988;16:285–294.
-
- Dembowski J, Lindstrom MJ, Westbury JR. Articulator point variability in the production of stop consonants. In: Cannito MP, Yorkston KM, Beukelman DR, editors. Neuromotor Speech Disorders: Nature, Assessment, and Management. Brookes; Baltimore: 1998. pp. 27–46.
-
- Flash T. The control of hand equilibrium trajectories in multi-joint arm movements. Biol. Cybern. 1987;57:257–274. - PubMed
Publication types
MeSH terms
Grants and funding
LinkOut - more resources
Full Text Sources