

Automated tri-image analysis of stored corneal endothelium
- PMID: 12084754
- PMCID: PMC1771188
- DOI: 10.1136/bjo.86.7.801
Automated tri-image analysis of stored corneal endothelium
Abstract
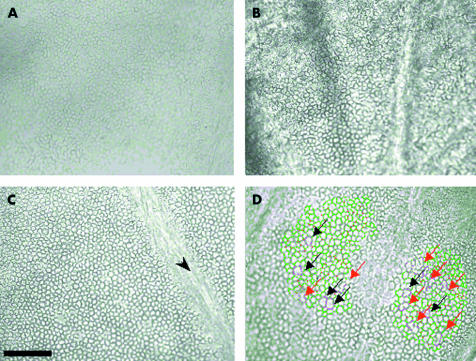
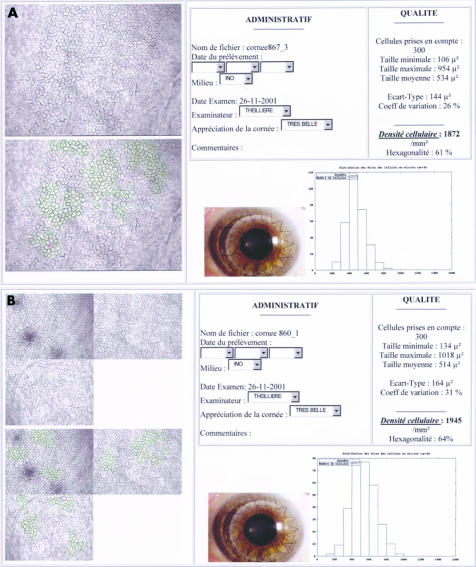
Background: Endothelial examination of organ culture stored corneas is usually done manually and on several mosaic zones. Some banks use an image analyser that takes account of only one zone. This method is restricted by image quality, and may be inaccurate if endothelial cell density (ECD) within the mosaic is not homogeneous. The authors have developed an analyser that has tools for automatic error detection and correction, and can measure ECD and perform morphometry on multiple zones of three images of the endothelial mosaic.
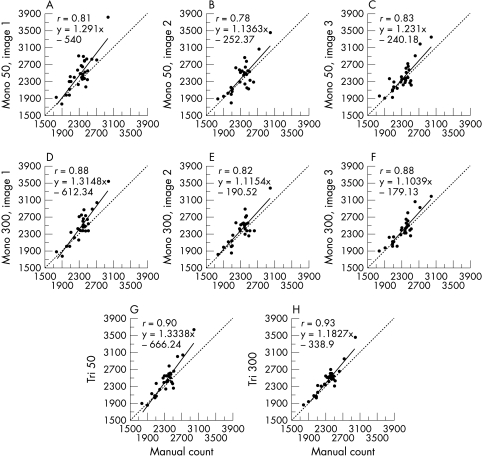
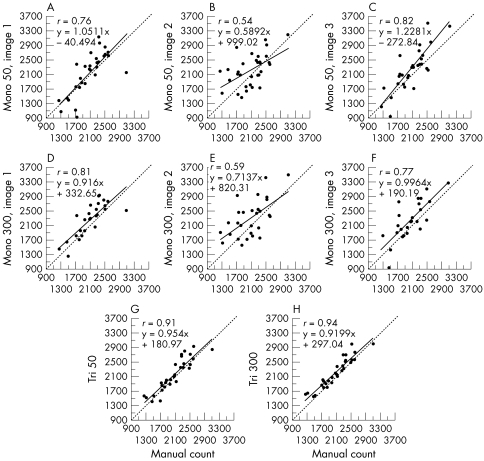
Methods: 60 human corneas were divided into two equal groups: group 1 with homogeneous mosaics, group 2 with heterogeneous ones. Three standard microscopy video images of the endothelium, graded by quality, were analysed either in isolation (so called mono-image analysis) or simultaneously (so called tri-image analysis), with 50 or 300 endothelial cells (ECs) counted. The automated analysis was compared with the manual analysis, which concerned 10 non-adjacent zones and about 300 cells. For each analysis method, failures and durations were studied according to image quality.
Results: All corneas were able to undergo analysis, in about 2 or 7.5 minutes for 50 and 300 ECs respectively. The tri-image analysis did not increase analysis time and never failed, even with mediocre images. The tri-image analysis of 300 ECs was always most highly correlated with the manual count, particularly in the heterogeneous cornea group (r=0.94, p<0.001) and prevented serious count errors.
Conclusions: This analyser allows reliable and rapid analysis of ECD, even for heterogeneous endothelia mosaics and mediocre images.
Figures
Similar articles
-
Endothelial morphometry by image analysis of corneas organ cultured at 31 degrees C.Invest Ophthalmol Vis Sci. 2010 Mar;51(3):1356-64. doi: 10.1167/iovs.08-3103. Epub 2009 Oct 22. Invest Ophthalmol Vis Sci. 2010. PMID: 19850847
-
Considering 3D topography of endothelial folds to improve cell count of organ cultured corneas.Cell Tissue Bank. 2017 Jun;18(2):185-191. doi: 10.1007/s10561-017-9624-7. Epub 2017 Apr 10. Cell Tissue Bank. 2017. PMID: 28397149
-
Reproducibility of endothelial assessment during corneal organ culture: comparison of a computer-assisted analyzer with manual methods.Invest Ophthalmol Vis Sci. 2007 May;48(5):2062-7. doi: 10.1167/iovs.06-1043. Invest Ophthalmol Vis Sci. 2007. PMID: 17460261
-
Comparison of endothelial cell density of organ cultured corneas with cornea donor study.Cornea. 2014 Jun;33(6):597-603. doi: 10.1097/ICO.0000000000000124. Cornea. 2014. PMID: 24809309
-
A Review On digital image processing techniques for in-Vivo confocal images of the cornea.Med Image Anal. 2021 Oct;73:102188. doi: 10.1016/j.media.2021.102188. Epub 2021 Jul 23. Med Image Anal. 2021. PMID: 34340102 Review.
Cited by
-
Controlled study of the influence of storage medium type on endothelial assessment during corneal organ culture.Br J Ophthalmol. 2004 Apr;88(4):579-81. doi: 10.1136/bjo.2003.022020. Br J Ophthalmol. 2004. PMID: 15031180 Free PMC article. Clinical Trial. No abstract available.
-
Epithelial Regeneration in Human Corneas Preserved in an Active Storage Machine.Transl Vis Sci Technol. 2021 Feb 5;10(2):31. doi: 10.1167/tvst.10.2.31. Transl Vis Sci Technol. 2021. PMID: 34003916 Free PMC article.
-
A new system for the automatic estimation of endothelial cell density in donor corneas.Br J Ophthalmol. 2005 Mar;89(3):306-11. doi: 10.1136/bjo.2004.051722. Br J Ophthalmol. 2005. PMID: 15722310 Free PMC article.
-
Dynamics of corneal endothelial cell death in organ culture.Br J Ophthalmol. 2003 Mar;87(3):376-7. doi: 10.1136/bjo.87.3.376-b. Br J Ophthalmol. 2003. PMID: 12598477 Free PMC article. No abstract available.
-
Is manual counting of corneal endothelial cell density in eye banks still acceptable? The French experience.Br J Ophthalmol. 2003 Dec;87(12):1481-6. doi: 10.1136/bjo.87.12.1481. Br J Ophthalmol. 2003. PMID: 14660458 Free PMC article.
References
-
- Delbosc B, Borderie V. Methods of preservation of the human corneas. J Fr Ophtalmol 1997;20:221–40. - PubMed
-
- Maas-Reijs J, Pels E, Tullo AB. Eye banking in Europe 1991–1995. Acta Ophthalmol Scand 1997;75:541–3. - PubMed
-
- French directory of corneal storage centres. 7th ed. 1999.
-
- Ohno K, Nelson LR, McLaren JW, et al. Comparison of recording systems and analysis methods in specular microscopy. Cornea 1999;18:416–23. - PubMed
-
- Benetz BA, Diaconu E, Bowlin SJ, et al. Comparison of corneal endothelial image analysis by Konan SP8000 noncontact and Bio-Optics Bambi systems. Cornea 1999;18:67–72. - PubMed
Publication types
MeSH terms
LinkOut - more resources
Full Text Sources