. 2002 Jul;120(1):15-27.
doi: 10.1085/jgp.20028571.

Spontaneous transient outward currents arise from microdomains where BK channels are exposed to a mean Ca(2+) concentration on the order of 10 microM during a Ca(2+) spark

Affiliations

Spontaneous transient outward currents arise from microdomains where BK channels are exposed to a mean Ca(2+) concentration on the order of 10 microM during a Ca(2+) spark

Ronghua Zhuge et al. J Gen Physiol. 2002 Jul.

Abstract

Ca(2+) sparks are small, localized cytosolic Ca(2+) transients due to Ca(2+) release from sarcoplasmic reticulum through ryanodine receptors. In smooth muscle, Ca(2+) sparks activate large conductance Ca(2+)-activated K(+) channels (BK channels) in the spark microdomain, thus generating spontaneous transient outward currents (STOCs). The purpose of the present study is to determine experimentally the level of Ca(2+) to which the BK channels are exposed during a spark. Using tight seal, whole-cell recording, we have analyzed the voltage-dependence of the STOC conductance (g((STOC))), and compared it to the voltage-dependence of BK channel activation in excised patches in the presence of different [Ca(2+)]s. The Ca(2+) sparks did not change in amplitude over the range of potentials of interest. In contrast, the magnitude of g((STOC)) remained roughly constant from 20 to -40 mV and then declined steeply at more negative potentials. From this and the voltage dependence of BK channel activation, we conclude that the BK channels underlying STOCs are exposed to a mean [Ca(2+)] on the order of 10 microM during a Ca(2+) spark. The membrane area over which a concentration > or =10 microM is reached has an estimated radius of 150-300 nm, corresponding to an area which is a fraction of one square micron. Moreover, given the constraints imposed by the estimated channel density and the Ca(2+) current during a spark, the BK channels do not appear to be uniformly distributed over the membrane but instead are found at higher density at the spark site.


Figures

F<sc>igure</sc> 1.
Figure 1.
Voltage dependence of conductance, frequency, and activation time constant of STOCs. For all STOC recordings in the study, EK was set at −28 mV. (A) Traces of STOCs recorded from the same cell at the holding potentials (Vh) shown. Horizontal bar, 10 s for all; vertical bar, 50 pA for 20 mV and 20 pA for all other Vhs. (B) Amplitude histograms of STOC conductance (g(STOC)) for each Vh, based on 2030 STOCs recorded from five cells. (C) Relationship between mean g(STOC) and Vh. (D) Relationship between STOC frequency and Vh. (E) STOC activation is accelerated at less negative potentials while inactivation is insensitive to changes in voltage. Time constants for STOC activation (dashed line) were derived by fitting the activation phase with I(t) = Imax[1 − exp(−t/τ)]3, where Imax is the peak current (ZhuGe et al., 2000). Time constants for STOC inactivation (solid line) were determined by fitting the decay phase with a single exponential.
F<sc>igure</sc> 2.
Figure 2.
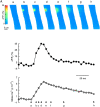
Ca2+ sparks recorded at −80 and 0 mV are of the same amplitude. (A) An example of a Ca2+ spark acquired at −80 mV in the presence of 1.8 mM extracellular Ca2+. Images show the spatial and temporal evolution of the Ca2+ spark. Top trace, the time course of change in fluorescence in the pixel (333 nm × 333 nm) where the peak fluorescence is reached, i.e., the epicenter pixel. Bottom trace, for the same spark, time course of Ca2+ signal mass, that is the total fluorescence for a volume subtended by an area 41 pixels on a side in the x-y plane and centered on the epicenter pixel. The signal mass is proportional to the total amount of Ca2+ released by the spark (see ZhuGe et al., 2000). (B, a) Amplitude histogram of Ca2+ sparks recorded at −80 and 0 mV and (b) their means. (c) Signal mass histogram of Ca2+ sparks recorded at −80 and 0 mV and (d) their means. (e) Mean frequency of Ca2+ sparks at −80 and 0 mV.
F<sc>igure</sc> 3.
Figure 3.
(A) Relationship between voltage dependence of g(STOC) and Po for BK channels. Red curve (continuous line connecting circles) is plot of g(STOC) as a function of holding potential based on the experiments in Fig. 1. Three black lines (dot-dashed, solid, and dashed) were drawn according to published data on Po of BK channels in excised inside-outside patches exposed to 1, 10, and 100 μM [Ca2+] in the same cell type (Singer and Walsh, 1987). The shaded area indicates the variation observed at 10 μM. As in the cited publication, the data are fit according to the Boltzmann relationship (Eq. 1). (B) Simulation of [Ca2+] spatial profile at the end of 15-ms pulses of 1 pA of Ca2+ current from the RyRs during a spark (50 μM fluo-3 plus 27 μM fixed buffer; black solid line) and 3 pA (50 μM fluo-3 plus 230 μM fixed buffer; red dashed line). Inset is the same plot on an expanded scale. The inset provides an indication of the lateral distance from the Ca2+ release site where the [Ca2+] reaches 10 μM in the two buffer conditions.
F<sc>igure</sc> 4.
Figure 4.
Simulations indicating that voltage dependence of g(STOC) is best explained by a model with an oasis of BK channels which sense a mean [Ca2+] on the order of 10 μM. The simulation of a “handshake” model is shown by lines “a” (dotted lines), uniform density of BK channels by lines “b” (dashed lines), and an oasis of BK channels by lines “c” (solid lines). The inset shows the results for an “extended oasis” model. Each of these models is described in the text. The two lines for each model correspond to two concentrations of fixed buffer, 27 μM (red lines) or 230 μM (black lines). For case “a,” the BK channels lie directly opposed to the RyRs, giving areas with a radius of 30 nm for the 27 μM buffer and 52 nm for the 230 μM. (The larger radius for the latter simulation results from the fact that ICa(spark) is larger in the latter case, with the density, ICa(spark)/μm2, kept constant.) For case “b,” the BK channels extended at a constant density for an “indefinite extent,” which we took to be 3 μm. For case “c,” the simulation converged on an area with a radius of 250 nm for 27 μM buffer and 450 nm for 230 μM buffer. In each case the Ca2+ release site (i.e., the RyRs) are located at a distance 25 nm from the plasma membrane. The details of the simulations are described in the materials and methods.
F<sc>igure</sc> 5.
Figure 5.
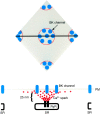
The “oasis” model of the spark-STOC microdomain. Top panel, the view of the BK channel distribution pattern as seen from the membrane surface. In the case of the oasis model, the channels at the spark site are confined to a region within the dotted circle. This region is less than one square micron in area (see text). In the case of the “extended oasis” model, there would be a ring of BK channels lying just outside the dotted circle (not depicted), which would not be activated by a Ca2+ spark. Bottom, cross-sectional view of the region marked by the black solid line in the top panel. Note that the distance between release site and plasma membrane is 25 nm. These depictions are qualitative representations and not drawn to scale.

Similar articles

Cited by

References

    1. Arnaudeau, S., F.X. Boittin, N. Macrez, J.L. Lavie, C. Mironneau, and J. Mironneau. 1997. L-type and Ca2+ release channel-dependent hierarchical Ca2+ signaling in rat portal vein myocytes. Cell Calcium. 22:399–411. - PubMed
    1. Becker, P.L., J.J. Singer, J.V. Walsh, Jr., and F.S. Fay. 1989. Regulation of calcium concentration in voltage-clamped single smooth muscle cells. Science. 244:211–214. - PubMed
    1. Benham, C.D., and T.B. Bolton. 1986. Spontaneous transient outward currents in single visceral and vascular smooth muscle cells of rabbit. J. Physiol. 381:385–406. - PMC - PubMed
    1. Bezprozvanny, I., J. Watras, and B.E. Ehrlich. 1991. Bell-shaped calcium-response curves of Ins(1,4,5)P3- and calcium-gated channels from endoplasmic reticulum of cerebellum. Nature. 351:751–754. - PubMed
    1. Bolton, T.B., and D.V. Gordienko. 1998. Confocal imaging of calcium release events in single smooth muscle cells. Acta Physiol. Scand. 164:567–575. - PubMed

Publication types

MeSH terms

Substances