. 2002 Jul;120(1):71-85.
doi: 10.1085/jgp.20018547.

cAMP increases density of ENaC subunits in the apical membrane of MDCK cells in direct proportion to amiloride-sensitive Na(+) transport

Affiliations

cAMP increases density of ENaC subunits in the apical membrane of MDCK cells in direct proportion to amiloride-sensitive Na(+) transport

Ryan G Morris et al. J Gen Physiol. 2002 Jul.

Abstract

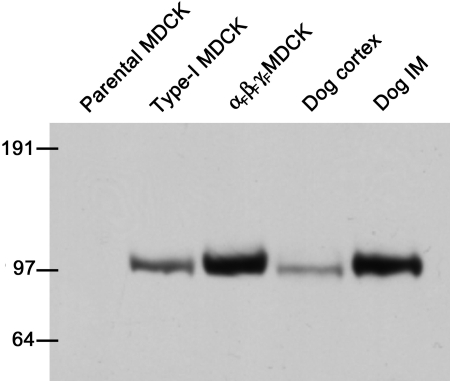
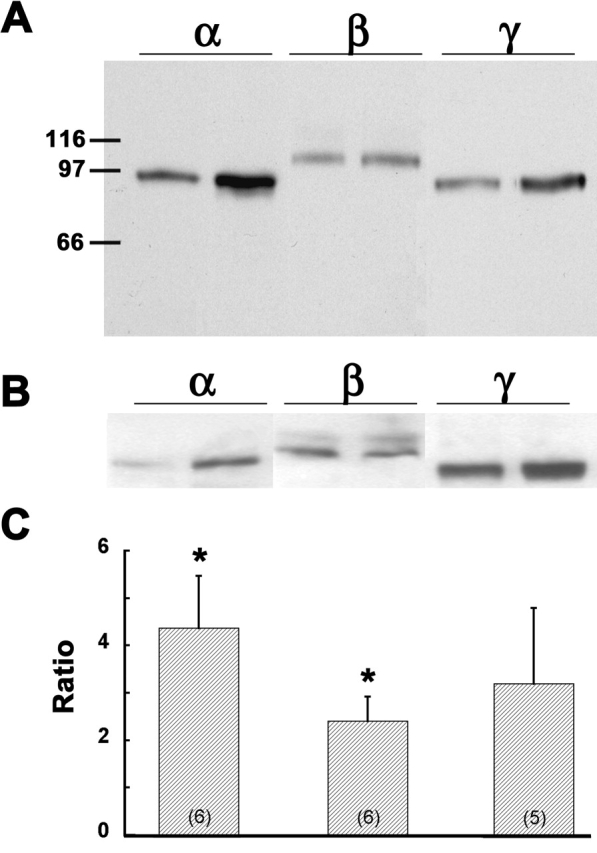
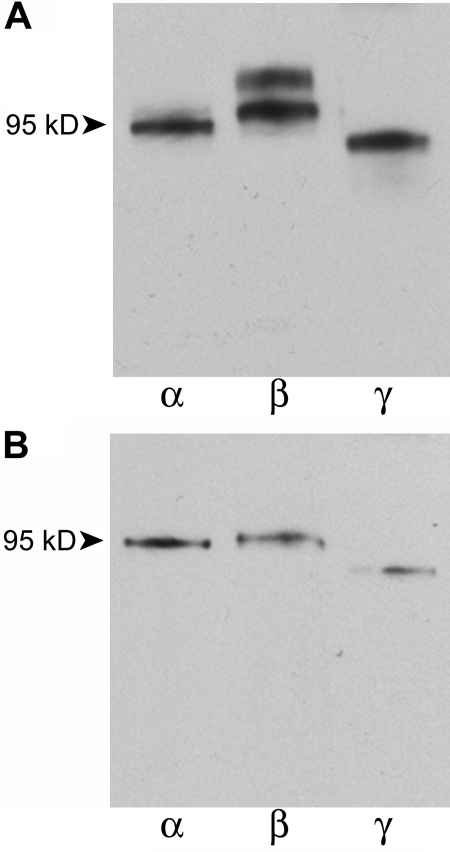
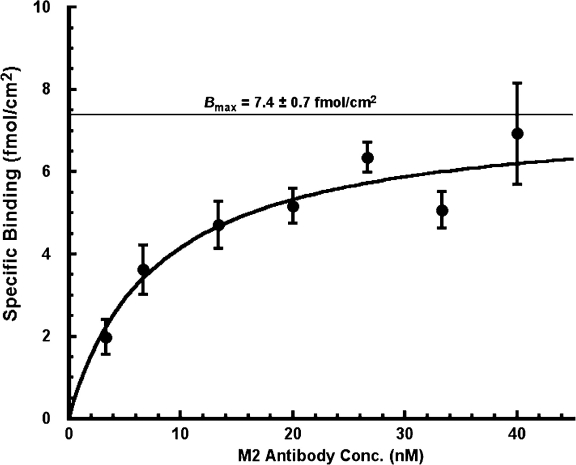
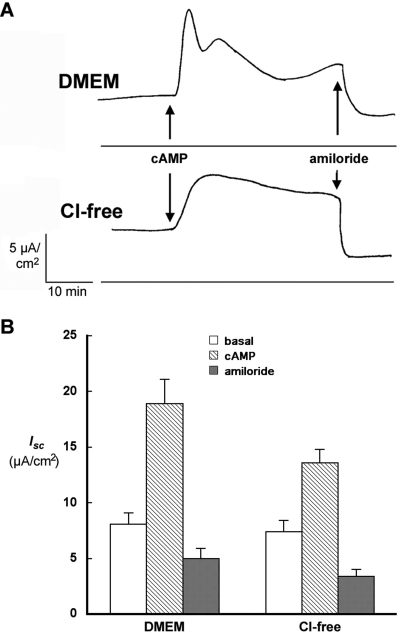
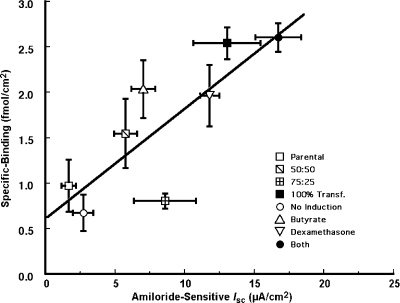
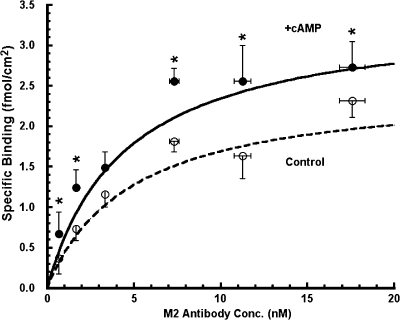
Antidiuretic hormone and/or cAMP increase Na(+) transport in the rat renal collecting duct and similar epithelia, including Madin-Darby canine kidney (MDCK) cell monolayers grown in culture. This study was undertaken to determine if that increment in Na(+) transport could be explained quantitatively by an increased density of ENaC Na(+) channels in the apical membrane. MDCK cells with no endogenous ENaC expression were retrovirally transfected with rat alpha-, beta-, and gammaENaC subunits, each of which were labeled with the FLAG epitope in their extracellular loop as described previously (Firsov, D., L. Schild, I. Gautschi, A.-M. Mérillat, E. Schneeberger, and B.C. Rossier. 1996. PROC: Natl. Acad. Sci. USA. 93:15370-15375). The density of ENaC subunits was quantified by specific binding of (125)I-labeled anti-FLAG antibody (M2) to the apical membrane, which was found to be a saturable function of M2 concentration with half-maximal binding at 4-8 nM. Transepithelial Na(+) transport was measured as the amiloride-sensitive short-circuit current (AS-I(sc)) across MDCK cells grown on permeable supports. Specific M2 binding was positively correlated with AS-I(sc) measured in the same experiments. Stimulation with cAMP (20 microM 8-p-chlorothio-cAMP plus 200 microM IBMX) significantly increased AS-I(sc) from 11.2 +/- 1.3 to 18.1 +/- 1.3 microA/cm(2). M2 binding (at 1.7 nM M2) increased in direct proportion to AS-I(sc) from 0.62 +/- 0.13 to 1.16 +/- 0.18 fmol/cm(2). Based on the concentration dependence of M2 binding, the quantity of Na(+) channels per unit of AS-I(sc) was calculated to be the same in the presence and absence of cAMP, 0.23 +/- 0.04 and 0.21 +/-0.05 fmol/microA, respectively. These values would be consistent with a single channel conductance of approximately 5 pS (typically reported for ENaC channels) only if the open probability is <0.02, i.e., less than one-tenth of the typical value. We interpret the proportional increases in binding and AS-I(sc) to indicate that the increased density of ENaC subunits in the apical membrane can account completely for the I(sc) increase produced by cAMP.


Figures

F<sc>igure</sc> 1.
Figure 1.
Western blot demonstrating the expression of the βENaC subunit in MDCK cells and dog kidney tissues. The lanes contained protein extracts from: parental MDCK cells (the line subsequently used for transfection of flagged ENaC subunits), another clone of Type-I MDCK cells, αFβFγF MDCK cells (the triply transfected cell line developed in this study), dog kidney cortex, and inner medulla. All three lines of MDCK cells were induced overnight with 2 mM butyrate plus 1 μM dexamethasone, and 20 μg of extracted protein was present in each lane. In the case of the dog kidney tissues, 50 μg of protein was present for each. The numbers on the left side indicate the molecular weights (kD) of proteins in the molecular weight calibration ladder.
F<sc>igure</sc> 2.
Figure 2.
Expression of ENaC subunits in retrovirally transfected MDCK cells with and without induction. (A) Western blot of protein from triple-flagged (αFβFγF MDCK) cells. The lanes are grouped according to the subunit-specific antibody, and in each subunit group extracts are from αFβFγF MDCK cells without (first lane of pair) and with (second lane) overnight induction with 2 mM butyrate plus 1 μM dexamethasone. The numbers on the left side indicate the molecular weights (kD) of proteins in the molecular weight calibration ladder. (B) Another composite of blots prepared in the same way as panel A, but showing the doublet for βENaC (see text). (C) Ratios of the densitometry measurements for the α-, β-, and γENaC subunit bands in the presence of induction to that in the absence of induction. The number of separate protein extractions and immunoblots is indicated in parentheses in each bar. Asterisk indicates average ratio is significantly different from 1.0.
F<sc>igure</sc> 3.
Figure 3.
Immunoprecipitation of ENaC subunits from lysates of αFβFγF MDCK cells induced with butyrate and dexamethasone. (A) Monoclonal anti-FLAG (M2) antibody was used to immunoprecipitate ENaC subunits. Three aliquots of the immunoprecipitate were subsequently visualized in immunoblots using polyclonal, subunit-specific anti-ENaC antibodies as probes. (B) Three aliquots of cell lysates were separately immunoprecipitated with polyclonal, subunit-specific anti-α, -β, and -γ antibodies. M2 antibody was used as the probe in immunoblots.
F<sc>igure</sc> 4.
Figure 4.
Specific binding of 125-I-labeled M2 antibody in αFβFγF MDCK cells as a function of antibody concentration. Cells were induced overnight with butyrate and dexamethasone, and the experiments were performed in DMEM. M2 antibody was added at seven different concentrations to the apical membrane only. The data were fit to the Michaelis-Menten relationship by nonlinear, weighted least squares (r = 0.95, P < 0.001). Estimates of maximal specific antibody binding in fmol/cm2 (B max) and affinity (k 0.5) were 7.4 ± 0.7 fmoles/cm2 and 7.9 ± 1.9 nM, respectively. Averages from seven experiments with 126 inserts.
F<sc>igure</sc> 5.
Figure 5.
Effect of Cl on the response of short-circuit current (I sc) to cAMP stimulation. (A) Time course of I sc response to cAMP treatment in DMEM and chloride-free medium. I sc was measured across monolayers of αFβFγF MDCK cells induced overnight with 2 mM butyrate and 1 μM dexamethasone. A mixture of 20 μM CPT-cAMP and 200 μM IBMX was added at the time indicated, followed by 20 μM amiloride. (B) Average I sc in experiments described in A. Six experiments were conducted in DMEM and 20 in chloride-free medium. Basal I sc was measured just before, and the cAMP I sc just after the addition of 20 μM CPT-cAMP plus 200 μM IBMX, at the point of maximal response, 5–10 min in DMEM and 10–20 min in chloride-free medium. The final measurement was made 1–3 min after the addition of 20 μM amiloride.
F<sc>igure</sc> 6.
Figure 6.
Correlation between specific binding of 125I-labeled M2 antibody and amiloride-sensitive short-circuit current (I sc). The M2 antibody concentration in the binding experiments was 16 nM. Chloride-free medium was used for both the apical and basolateral solutions. Two methods were used to vary the range of I sc in the MDCK cultures: (a) the culture inserts were seeded with mixtures of αFβFγF and parental MDCK cells (square data points, with ratio of parental to αFβFγF MDCK cells indicated in the symbol key). (b) The αFβFγF MDCK cells either were given no induction or were induced with 2 mM butyrate and/or 1 μM dexamethasone, as indicated in the symbol key. The least-squares linear regression, indicated by the line, has a slope of 0.12 ± 0.03 fmol/μA (P < 0.001) and intercept of 0.62 ± 0.33 (NS). The correlation coefficient r is 0.82 (P < 0.001).
F<sc>igure</sc> 7.
Figure 7.
Specific binding of 125I-labeled M2 antibody in αFβFγF MDCK cells as a function of antibody concentration in the presence and absence of cAMP treatment. In each of six experiments, 72 culture inserts were incubated in chloride-free medium for 30–40 min at 37°C. At this point, 20 μM CPT-cAMP plus 200 μM IBMX was added to the apical solution of one-half of the inserts (+cAMP) and only the vehicle to the other half (control). 30 min after cAMP treatment, the inserts where chilled in an ice bath and surface labeling was conducted as described in materials and methods. Specifically bound 125I-labeled M2 antibody is plotted as a function of the 125I-labeled M2 antibody concentration added to the apical membrane. The data were fit to the Michaelis-Menten relationship by nonlinear regression (control: r = 0.99, P < 0.001; +cAMP: r = 0.97, P < 0.001). Asterisk denotes specific binding was significantly higher in cAMP-treated than controls.

Similar articles

Cited by

References

    1. Berdiev, B.K., A.G. Prat, H.F. Cantiello, D.A. Ausiello, C.M. Fuller, B. Jovov, D.J. Benos, and I.I. Ismailov. 1996. Regulation of epithelial sodium channels by short actin filaments. J. Biol. Chem. 271:17704–17710. - PubMed
    1. Bindels, R.J.M., J.A. Schafer, and M.C. Reif. 1988. Stimulation of sodium transport by aldosterone and arginine vasotocin in A6 cells. Biochim. Biophys. Acta. 972:320–330. - PubMed
    1. Blazer-Yost, B.L., and S.I. Helman. 1997. The amiloride-sensitive epithelial Na+ channel: binding sites and channel densities. Am. J. Physiol. 272:C761–C769. - PubMed
    1. Bradford, A.L., I.I. Ismailov, J.M. Achard, D.G. Warnock, J.K. Bubien, and D.J. Benos. 1995. Immunopurification and functional reconstitution of a Na+ channel complex from rat lymphocytes. Am. J. Physiol. 269:C601–C611. - PubMed
    1. Bridges, R.J., W. Rummel, and P. Wollenberg. 1984. Effects of vasopressin on electrolyte transport across isolated colon from normal and dexamethasone-treated rats. J. Physiol. 355:11–23. - PMC - PubMed

Publication types