. 2002 Jul 9;99(14):9316-21.
doi: 10.1073/pnas.142162499. Epub 2002 Jun 25.

The genome-wide expression response to telomerase deletion in Saccharomyces cerevisiae

Affiliations

The genome-wide expression response to telomerase deletion in Saccharomyces cerevisiae

Shivani Nautiyal et al. Proc Natl Acad Sci U S A. .

Erratum in

  • Proc Natl Acad Sci U S A. 2004 Aug 31;101(35):13100

Abstract

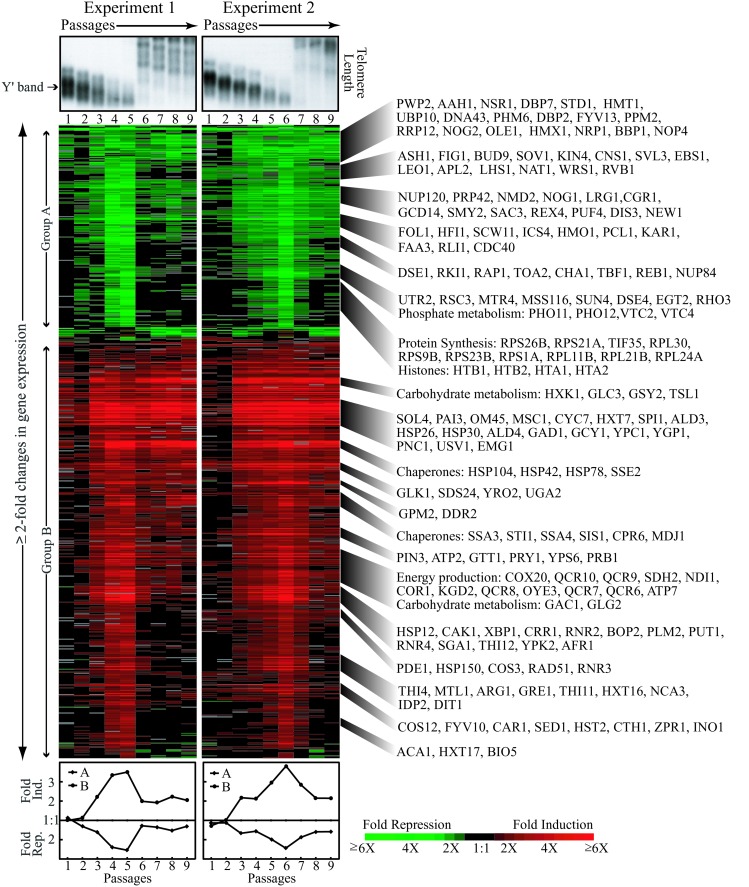
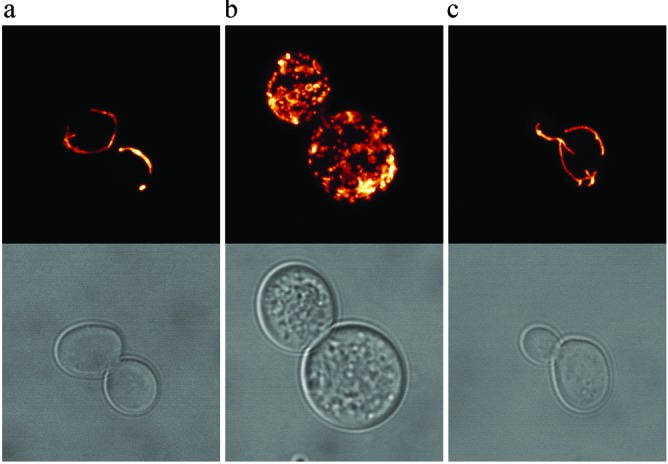
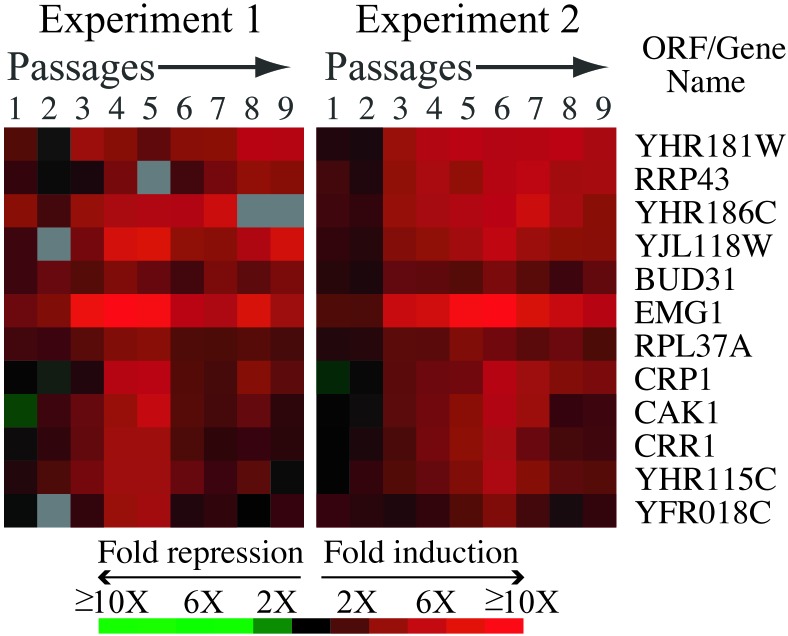
Loss of the protective function of telomeres has previously been hypothesized to cause a DNA damage response. Here, we report a genome-wide expression response, the telomerase deletion response (TDR), that occurs when telomeres can no longer be maintained by telomerase. The TDR shares features with other DNA damage responses and the environmental stress response. Unexpectedly, another feature of the TDR is the up-regulation of energy production genes, accompanied by a proliferation of mitochondria. Finally, a discrete set of genes, the "telomerase deletion signature", is uniquely up-regulated in the TDR but not under other conditions of stress and DNA damage that have been reported. The telomerase deletion signature genes define new candidates for involvement in cellular responses to altered telomere structure or function.


Figures

Figure 1
Figure 1
Effects of deleting TLC1 on telomere length, viability, and budding index of cells for duplicate time courses. (a) Telomere length analysis. Southern analysis of XhoI-digested genomic DNA prepared from each time point probed with a telomeric repeat oligonucleotide. Brackets mark the presurvivor Y′-containing telomeric band. The first lane shows telomere length before counterselection of pRS316-TLC1. (b) Viability as measured by colony forming units (CFU) per unit of OD A600. (c) Approximate distribution of cells throughout the cell cycle. Unbudded cells (●) correspond roughly to G1, small-budded (♦) to late G1 and S phase, and large-budded (▴) to G2/M and early G1. ×, multibudded cells.
Figure 2
Figure 2
Gene expression changes in Δtlc1 mutants. (Top) Y′-containing telomere portion of the Southern blot analysis of telomere length. (Middle) Hierarchical clustering of ≈650 ORFs whose expression changed by 2-fold or more relative to wild-type cells in both time courses. Each column represents expression of genes for a single time point. Each row represents the expression pattern of a single gene at all time points analyzed. Gene expression ratios shown in red are up-regulated and those in green are down-regulated. Gray areas indicate missing data. Ratios <1.5-fold are in black. Examples of genes from various clusters are provided. (Bottom) Average fold repression and induction as a function of passage for group A and group B genes.
Figure 3
Figure 3
The TDR is distinct from other DNA damage responses. The expression profiles of the ≈650 TDR genes were compared with their expression in reported profiles for DNA damage induced by MMS and IR treatment in both wild-type and mec1 strains (28, 36) and in reported profiles for an unrepaired HO endonuclease cut in cells arrested with nocodozole in G2/M (29). Additional experiments that were used to generate this cluster but are not shown were MMS treatment in a dun1 strain, mock irradiation controls, and control expression profiles of wild-type cells relative to a mec1 mutant (28, 36). The complete comparison can be downloaded from http://biochemistry.ucsf.edu/∼blackburn/TDR. Examples of genes from various clusters are given. Regions boxed in yellow highlight features of the TDR that are distinct from the DNA damage responses shown.
Figure 4
Figure 4
Confocal imaging of GFP-labeled mitochondria from representative presenescent (a), senescent (b), and survivor (c) cells. (Upper) Projection of fluorescence images collected along x and y planes of the GFP-labeled sample. The fluorescence signal is pseudocolored using an orange-to-white gradient that reflects pixel intensity. (Lower) Brightfield views of the cells.
Figure 5
Figure 5
Telomerase deletion signature genes. These genes are induced in the Δtlc1 experiments but are generally not induced in over 20 conditions of stress (11, 36) and DNA damage (28, 29, 36) that have been described.

Similar articles

Cited by

References

    1. Garvik B, Carson M, Hartwell L. Mol Cell Biol. 1995;15:6128–6138. - PMC - PubMed
    1. Karlseder J, Broccoli D, Dai Y, Hardy S, de Lange T. Science. 1999;283:1321–1325. - PubMed
    1. Lundblad V. Mutat Res. 2000;451:227–240. - PubMed
    1. Lundblad V, Blackburn E H. Cell. 1993;73:347–360. - PubMed
    1. Singer M S, Gottschling D E, Wotton D, Shore D. Science. 1994;266:404–409. - PubMed

Publication types

LinkOut - more resources