. 2002 Jul 9;99(14):9310-5.
doi: 10.1073/pnas.152101299. Epub 2002 Jun 25.

Live-cell imaging reveals divergent intracellular dynamics of polyglutamine disease proteins and supports a sequestration model of pathogenesis

Affiliations

Live-cell imaging reveals divergent intracellular dynamics of polyglutamine disease proteins and supports a sequestration model of pathogenesis

Yaohui Chai et al. Proc Natl Acad Sci U S A. .

Abstract

Protein misfolding and aggregation are central features of the polyglutamine neurodegenerative disorders, but the dynamic properties of expanded polyglutamine proteins are poorly understood. Here, we use fluorescence recovery after photobleaching (FRAP) and fluorescence loss in photobleaching (FLIP) with green fluorescent protein fusion proteins to study polyglutamine protein kinetics in living cells. Our results reveal markedly divergent mobility states for an expanded polyglutamine protein, ataxin-3, and establish that nuclear inclusions formed by this protein are aggregates. Additional studies of green fluorescent protein-tagged cAMP response element binding protein coexpressed with either of two mutant polyglutamine proteins, ataxin-3 and huntingtin, support a model of disease in which coaggregation of transcriptional components contributes to pathogenesis. Finally, studies of a third polyglutamine disease protein, ataxin-1, reveal unexpected heterogeneity in the dynamics of inclusions formed by different disease proteins, a finding which may help explain disease-specific elements of pathogenesis in these neurodegenerative disorders.


Figures

Figure 1
Figure 1
FRAP Analysis of ataxin-3 in the nucleus. COS7 cells expressing GFP-tagged normal or expanded ataxin-3 were imaged immediately before photobleaching a defined zone in the nucleus (boxed area), then afterward at the indicated times. (A) When diffusely distributed in the nucleoplasm, normal (Upper) and expanded (Lower) GFP-ataxin-3 show an immediate decrease in fluorescence throughout the nucleus without a detectable bleached zone. (B) In contrast, mutant ataxin-3 in nuclear inclusions is fully bleached and shows no recovery. This occurs with bleaching of a full (Upper) or half (Lower) of an inclusion. (A and B, bars = 10 μm.)
Figure 2
Figure 2
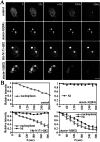
FLIP Analysis of ataxin-3 in the nucleus and cytoplasm. COS7 cells expressing normal or expanded GFP-ataxin-3 were repeatedly bleached at the indicated zone (box) in the nucleus or cytoplasm and imaged between consecutive bleach pulses. (A) Nuclear FLIP. Normal (Upper) and mutant (Lower) ataxin-3 diffusely distributed in the nucleoplasm show rapid and complete bleaching with nuclear FLIP. Ataxin-3 within NI (Lower) shows no loss of fluorescence with nuclear FLIP. (B) Quantification of fluorescence loss for normal and mutant ataxin-3 with nuclear FLIP. (C) Cytoplasmic FLIP. Both normal and mutant ataxin-3 show loss of fluorescence signal over time, first from the cytoplasm, then from the nucleus. Both normal (Upper) and mutant (Lower) nucleoplasmic ataxin-3 show fluorescence loss over time. In contrast, ataxin-3 within NI (Lower) shows no loss of fluorescence (Lower). (D) Quantification of fluorescence loss for normal and mutant ataxin-3 with cytoplasmic FLIP. Curves in B and D depict mean values (± SEM) from three representative cells, including those shown in A and C. (A and C, bar = 10 μm.)
Figure 3
Figure 3
GFP-CBP recruitment to different polyQ protein inclusions. Confocal immunofluorescence images of HeLa cells expressing GFP-CBP alone or together with different expanded polyQ proteins. Each set of panels shows GFP-CBP (green), immunofluorescence for the indicated polyQ protein (red), and merged images. GFP-CBP is recruited to inclusions formed by full-length ataxin-3, a truncated fragment of ataxin-3 (HA-Q78), huntingtin fragment (htt-N171), or full-length ataxin-1. Ataxin-1 shows only partial recruitment of CBP in a subset of cells, as shown here. (Bar = 10 μm.)
Figure 4
Figure 4
FRAP Analysis of GFP-CBP in ataxin-3 inclusions. HeLa cells expressing GFP-CBP alone (A) or together with ataxin-3 (B) were imaged before and during recovery after bleaching (boxes). Images were taken at the indicated times after the bleach pulse. (A) Rapid fluorescence recovery for GFP-CBP expressed alone. (B) No fluorescence recovery for GFP-CBP within NI formed by full-length ataxin-3 (Top and Middle) or by truncated ataxin-3 (HA-Q78; Bottom) (Bar = 10 μm.). (Inset) Enlarged view of NI formed by HA-Q78 (arrow), illustrating the characteristic fluorescence at the perimeter of these NI. (C) Quantitative analyses of FRAP results showing rapid fluorescence recovery for nucleoplasmic GFP-CBP (Left), but not for GFP-CBP within NI (Right). Curves depict mean values (± SEM) from measurements of three representative cells.
Figure 5
Figure 5
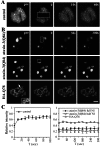
FRAP Analysis of GFP-CBP in huntingtin or ataxin-1 inclusions. HeLa cells expressing GFP-CBP together with truncated huntingtin (A) or full-length ataxin-1 (B) were imaged before and during recovery after bleaching (boxes). Images were taken at the indicated times after the bleach pulse. (A) Huntingtin-expressing cell that contains one NI and one CI, to both of which GFP-CBP colocalized. Sequential FRAP was performed on half of each inclusion, beginning with the NI (Upper) followed by the CI (Lower). Neither inclusion shows fluorescence recovery. (B) In contrast, GFP-CBP localized to an inclusion formed by ataxin-1 shows significant fluorescence recovery. (Bar = 10 μm.) (C) Quantitative analyses of FRAP results. Curves depict mean values (± SEM) from measurements of three representative cells including those shown.
Figure 6
Figure 6
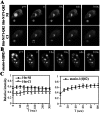
FLIP analysis of GFP-CBP in nucleoplasm vs. inclusions. (A) HeLa cells expressing GFP-CBP alone or together with expanded ataxin-3, huntingtin, or ataxin-1 were repeatedly bleached at the indicated nuclear zone (boxed areas) and imaged between consecutive bleach pulses. When expressed alone (control), GFP-CBP shows loss of fluorescence signal with FLIP, as expected. In cells with ataxin-3 NI, GFP-CBP quantitatively localizes to NI, and FLIP shows no loss of fluorescence from NI. In cells containing NI of huntingtin, GFP-CBP that remains nucleoplasmic (i.e., not recruited to NI) shows fluorescence loss, but GFP-CBP in NI does not. In contrast, GFP-CBP localizing to ataxin-1 NI shows nearly complete fluorescence loss with FLIP. (Bar = 10 μm.) (B) Quantitative analyses of FLIP results. Curves depict mean values (± SEM) from measurements of three representative cells.

Similar articles

Cited by

References

    1. Margolis R L, Ross C A. Trends Mol Med. 2001;7:479–482. - PubMed
    1. Cummings C J, Mancini M A, Antalffy B, DeFranco D B, Orr H T, Zoghbi H Y. Nat Genet. 1998;19:148–154. - PubMed
    1. Chai Y, Koppenhafer S L, Shoesmith S J, Perez M K, Paulson H L. Hum Mol Genet. 1999;8:673–682. - PubMed
    1. Stenoien D L, Cummings C J, Adams H P, Mancini M G, Patel K, DeMartino G N, Marcelli M, Weigel N L, Mancini M A. Hum Mol Genet. 1999;8:731–741. - PubMed
    1. Chai Y, Koppenhafer S L, Bonini N M, Paulson H L. J Neurosci. 1999;19:10338–10347. - PMC - PubMed

Publication types

MeSH terms

LinkOut - more resources