. 2002 Jun;14(6):1191-206.
doi: 10.1105/tpc.000877.

Contrapuntal networks of gene expression during Arabidopsis seed filling

Affiliations

Contrapuntal networks of gene expression during Arabidopsis seed filling

Sari A Ruuska et al. Plant Cell. 2002 Jun.

Abstract

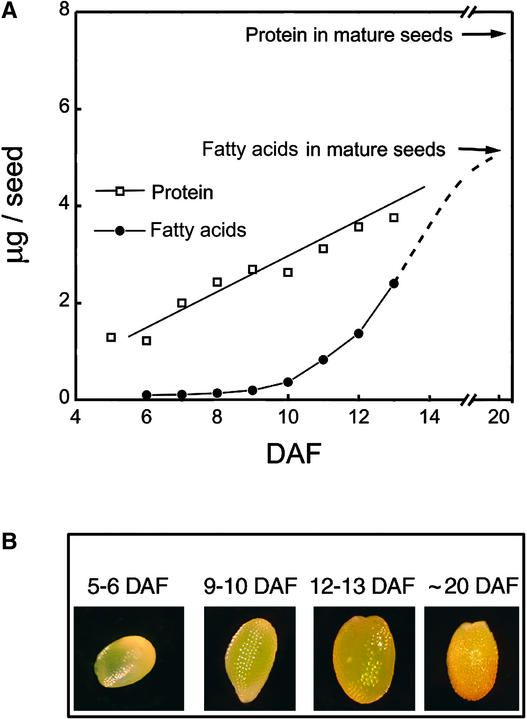
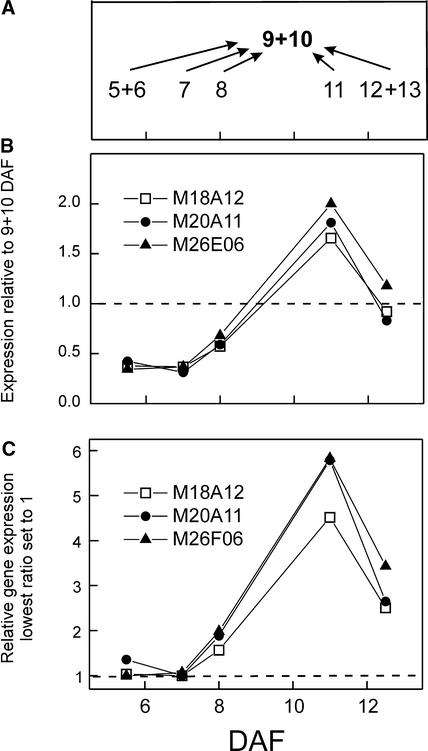
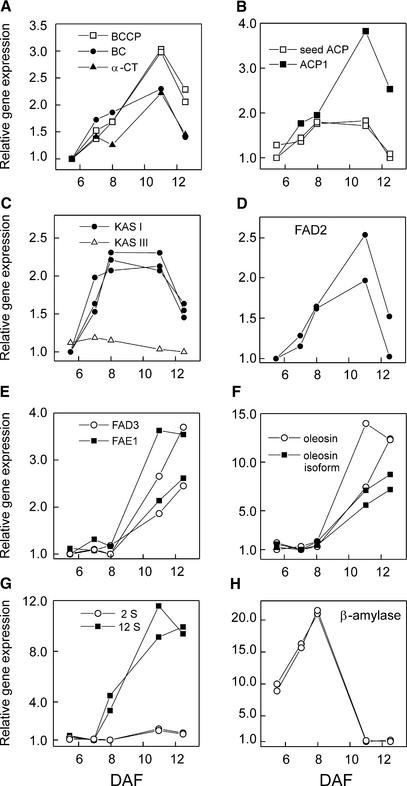
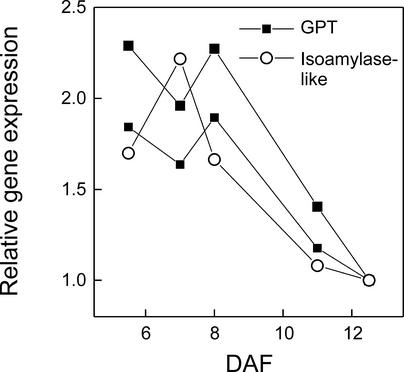
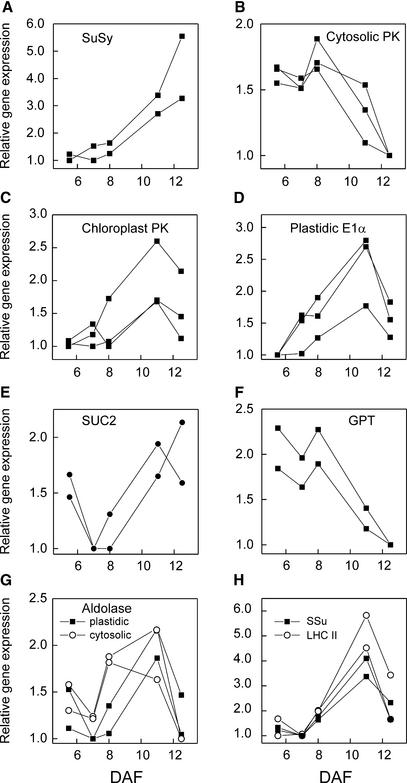
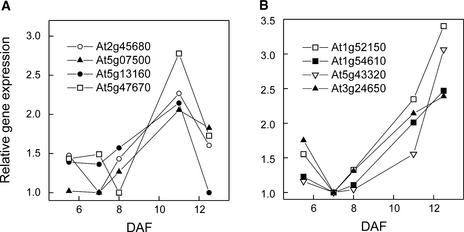
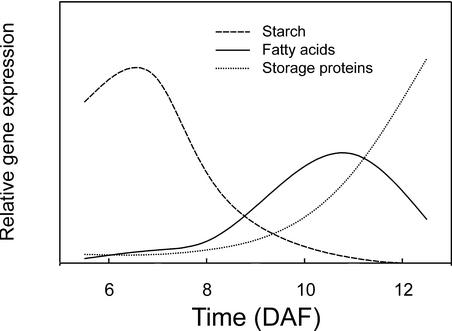
We have used cDNA microarrays to examine changes in gene expression during Arabidopsis seed development and to compare wild-type and mutant wrinkled1 (wri1) seeds that have an 80% reduction in oil. Between 5 and 13 days after flowering, a period preceding and including the major accumulation of storage oils and proteins, approximately 35% of the genes represented on the array changed at least twofold, but a larger fraction (65%) showed little or no change in expression. Genes whose expression changed most tended to be expressed more in seeds than in other tissues. Genes related to the biosynthesis of storage components showed several distinct temporal expression patterns. For example, a number of genes encoding core fatty acid synthesis enzymes displayed a bell-shaped pattern of expression between 5 and 13 days after flowering. By contrast, the expression of storage proteins, oleosins, and other known abscisic acid-regulated genes increased later and remained high. Genes for photosynthetic proteins followed a pattern very similar to that of fatty acid synthesis proteins, implicating a role in CO(2) refixation and the supply of cofactors for oil synthesis. Expression profiles of key carbon transporters and glycolytic enzymes reflected shifts in flux from cytosolic to plastid metabolism. Despite major changes in metabolism between wri1 and wild-type seeds, <1% of genes differed by more than twofold, and most of these were involved in central lipid and carbohydrate metabolism. Thus, these data define in part the downstream responses to disruption of the WRI1 gene.


Figures

Figure 1.
Figure 1.
Development of Arabidopsis Seeds during the Experimental Period. (A) Time courses of total fatty acid and total protein accumulation in developing wild-type Arabidopsis seeds. Values are averages of two independent measurements, and the seed material used was the same as for the microarray experiments. The arrows indicate the typical fatty acid and protein contents of mature, dry seeds. The dotted line illustrates the typical accumulation pattern for storage oil, which reaches its maximum at ∼18 DAF (Focks and Benning, 1998). The protein content increases more steadily. (B) Seeds at the beginning of the microarray time course (5 to 6 DAF), at the midstage (used for reference; 9 to 10 DAF), at the end of the experimental period (12 to 13 DAF), and at ∼20 DAF, when the seeds are fully mature and begin to desiccate.
Figure 2.
Figure 2.
Experimental Procedure and Conversion of the Expression Ratios. (A) Five different time points were compared with the common reference (9 to 10 DAF). (B) Expression profiles of three clones mapped to chlorophyll a/b binding protein. The average expression ratios from two hybridizations, relative to 9+10 DAF, are shown. (C) The lowest average expression ratio for each clone was set to 1, and the other ratios were adjusted accordingly.
Figure 3.
Figure 3.
Expression Profiles of Storage Compound–Related Genes. (A) Biotin carboxyl carrier protein (BCCP), biotin carboxylase (BC), and α-carboxyltransferase (α-CT) subunits of plastidial acetyl-CoA carboxylase. (B) Acyl carrier protein1 precursor (ACP1) and seed ACP. (C) 3-Ketoacyl-ACP synthase I (KAS I) and 3-ketoacyl-ACP synthase III (KAS III). (D) Oleate desaturase (FAD2). (E) Linoleate desaturase (FAD3) and fatty acid elongase1 (FAE1). (F) Oleosin isoform and 18.5-kD oleosin. (G) Storage proteins 12S and 2S. (H) β-Amylase. Expression is related to 9+10 DAF, and the ratios were rescaled by setting the lowest ratio to 1. See Methods for accession numbers.
Figure 5.
Figure 5.
Coordinated Downregulation of the Import of Glc-6-P into Plastids and Starch Metabolism. Presented are chloroplast Glc-6-P translocator (GPT; see Figure 4F) and isoamylase-like protein. See Methods for accession numbers.
Figure 4.
Figure 4.
Expression Profiles of Carbohydrate Metabolism–Related Genes. (A) Suc synthase (SuSy). (B) Cytosolic pyruvate kinase (PK). (C) Chloroplast pyruvate kinase. (D) Chloroplast E1α subunit of pyruvate dehydrogenase. (E) Suc-proton transporter protein (SUC2). (F) Chloroplast Glc-6-P translocator (GPT). (G) Chloroplast and cytosolic aldolases. (H) Photosystem II light-harvesting complex protein (LHC II) and small subunit of Rubisco (SSu). Expression is related to 9+10 DAF, and the ratios were rescaled by setting the lowest ratio to 1. See Methods for accession numbers.
Figure 6.
Figure 6.
Contrapuntal Patterns of Gene Expression for Proteins Involved in the Conversion of Suc to Oil in Developing Arabidopsis Seeds. Only the major enzymes and transporters involved in the conversion of Suc to oil are shown. Microarray expression patterns for enzymes in the cytosol are shown with red lines, reactions in the plastid are shown with green lines, and membrane transporters are shown with blue lines. Gray arrows indicate reactions or transporters whose expression decreases during development; they are believed to carry less flux than the major pathway represented by brown arrows. The shift during development from starch biosynthesis and cytosolic metabolism of PEP to oil biosynthesis and plastid uptake and metabolism of PEP is reflected in the coordinated expression patterns of enzymes and transporters. Not shown are additional contributions to oil metabolism, such as dark and light reactions of photosynthesis, the oxidative pentose phosphate pathway, and others. AcCoa, acetyl-CoA; FAS, fatty acid synthesis; GPT, glc-6-P translocator; MalCoA, malonyl-CoA; Pyr, pyruvate; TAG, triacylglyceride; TP, triose phosphate; TPT, triose-P translocator.
Figure 7.
Figure 7.
Examples of Expression Profiles for Putative Regulatory Factors. (A) Genes that follow the expression of ACCase-type FAS enzymes: putative PCF2-like DNA binding protein (At2g45680; open circles); zinc finger transcription factor (At5g07500; closed triangles); protein kinase–like protein (At5g13160; closed circles); and CCAAT-box binding transcription factor-like protein (At5g47670; open squares). (B) Genes whose expression increases during active oil accumulation: putative HD-Zip protein (At1g52150; open squares); putative CRK1 protein (At1g54610; closed squares); casein kinase (At5g43320; open inverted triangles); and ABI3 (At3g24650; closed triangles). Expression is related to 9+10 DAF, and the ratios were rescaled by setting the lowest ratio to 1.
Figure 8.
Figure 8.
Summary of Temporal Expression Patterns for Genes Involved in the Synthesis of Different Storage Compounds.

Similar articles

Cited by

References

    1. Arabidopsis Genome Initiative. (2000). Analysis of the genome sequence of the flowering plant Arabidopsis thaliana. Nature 408, 796–815. - PubMed
    1. Bowman, J.L., and Mansfield, S.G. (1994). Embryogenesis: Introduction. In Arabidopsis: An Atlas of Morphology and Development, J.L. Bowman, ed (New York: Springer-Verlag), pp. 351–361.
    1. Browse, J., McCourt, P.J., and Somerville, C.R. (1986). Fatty acid composition of leaf lipids determined after combined digestion and fatty acid methyl ester formation from fresh tissue. Anal. Biochem. 152, 141–145. - PubMed
    1. Bruce, W., Folkerts, O., Garnaat, C., Crasta, O., Roth, B., and Bowen, B. (2000). Expression profiling of the maize flavonoid pathway genes controlled by estradiol-inducible transcription factors CRC and P. Plant Cell 12, 65–79. - PMC - PubMed
    1. DeRisi, J.L., Iyer, V.R., and Brown, P.O. (1997). Exploring the metabolic and genetic control of gene expression on a genomic scale. Science 278, 680–686. - PubMed

Publication types

MeSH terms