. 2002 Jun;14(6):1235-51.
doi: 10.1105/tpc.010433.

A mitochondrial complex I defect impairs cold-regulated nuclear gene expression

Affiliations

A mitochondrial complex I defect impairs cold-regulated nuclear gene expression

Byeong-ha Lee et al. Plant Cell. 2002 Jun.

Abstract

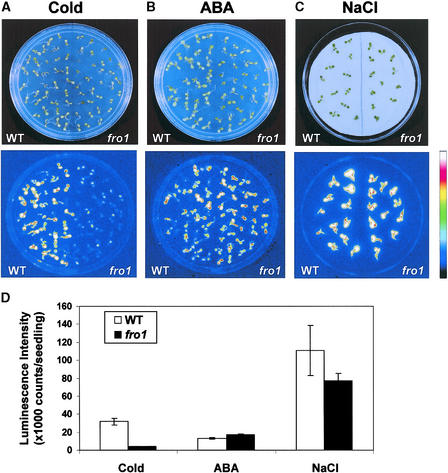
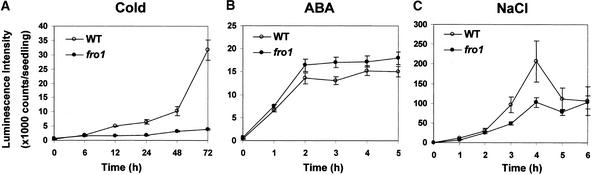
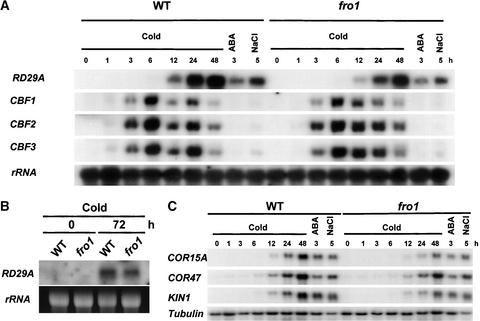
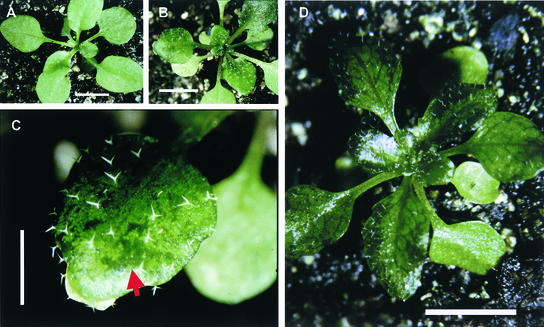
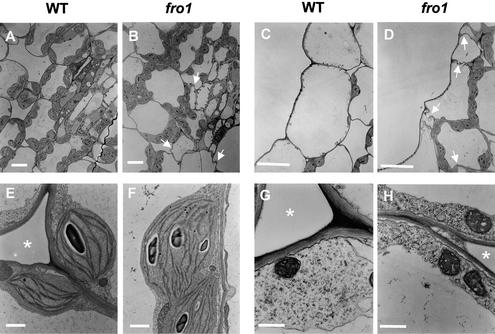
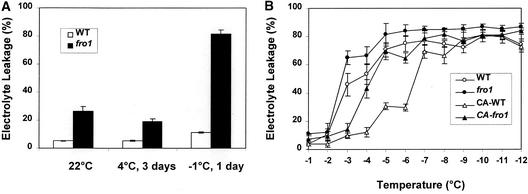
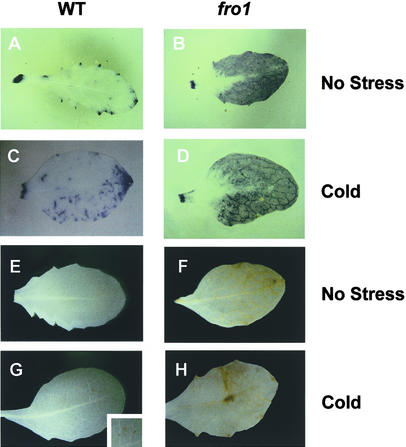
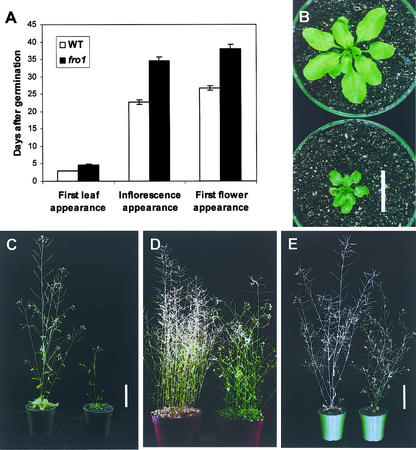
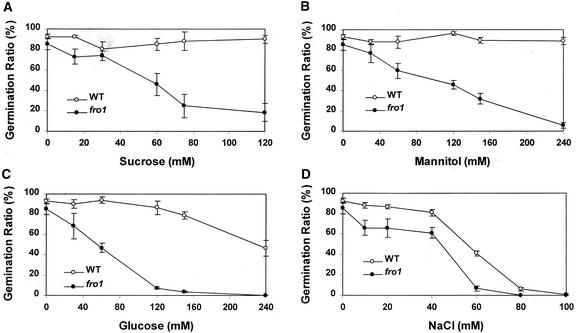
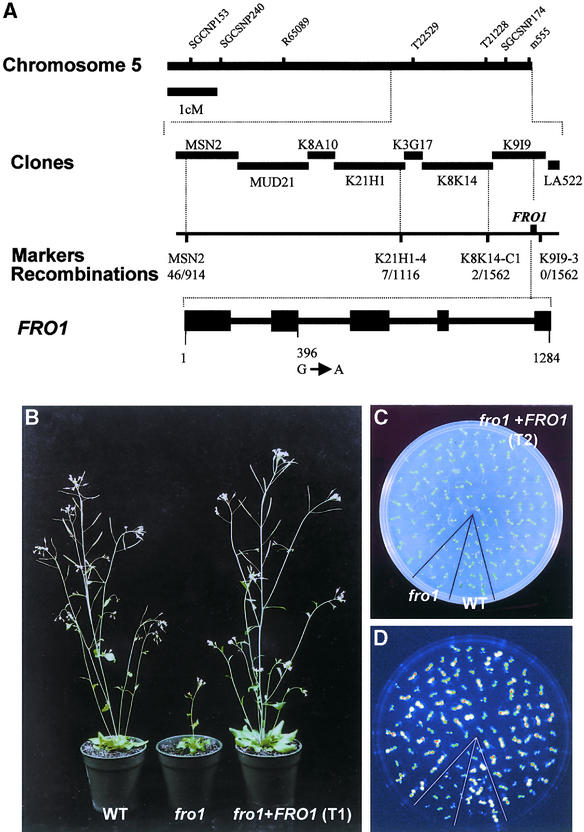
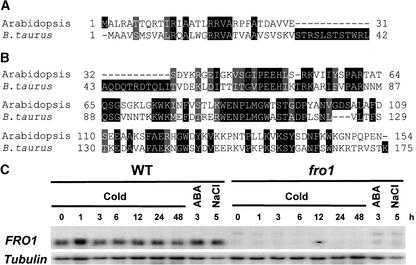
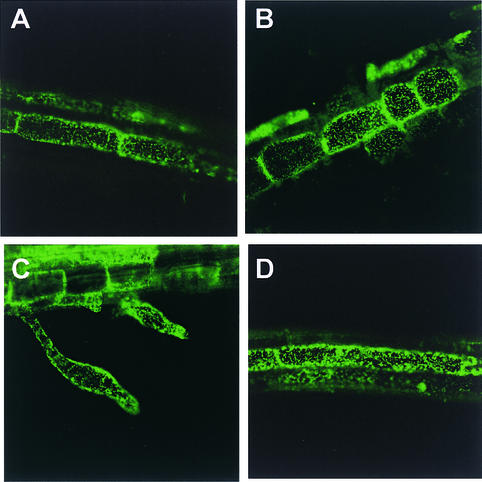
To study low-temperature signaling in plants, we previously screened for cold stress response mutants using bioluminescent Arabidopsis plants that express the firefly luciferase reporter gene driven by the stress-responsive RD29A promoter. Here, we report on the characterization and cloning of one mutant, frostbite1 (fro1), which shows reduced luminescence induction by cold. fro1 plants display reduced cold induction of stress-responsive genes such as RD29A, KIN1, COR15A, and COR47. fro1 leaves have a reduced capacity for cold acclimation, appear water-soaked, leak electrolytes, and accumulate reactive oxygen species constitutively. FRO1 was isolated through positional cloning and found to encode a protein with high similarity to the 18-kD Fe-S subunit of complex I (NADH dehydrogenase, EC 1.6.5.3) in the mitochondrial electron transfer chain. Confocal imaging shows that the FRO1:green fluorescent protein fusion protein is localized in mitochondria. These results suggest that cold induction of nuclear gene expression is modulated by mitochondrial function.


Figures

Figure 1.
Figure 1.
RD29A::LUC Luminescence Images of Wild-Type and fro1 Seedlings. (A) Morphology of seedlings on an agar plate and their luminescence images after treatment at 0°C for 72 h. (B) Morphology of seedlings on an agar plate and their luminescence images after treatment with 100 μM abscisic acid for 3 h. (C) Morphology of seedlings on an agar plate and their luminescence images after treatment with 300 mM NaCl for 5 h. The color scale bar at right shows the luminescence intensity from black (lowest) to white (highest). (D) Luminescence intensities of wild-type and fro1 seedlings after each treatment. ABA, abscisic acid; WT, wild type.
Figure 2.
Figure 2.
Time Courses of RD29A::LUC Expression in Wild-Type and fro1 Seedlings in Response to Cold, Abscisic Acid, or NaCl. (A) RD29A::LUC expression after low-temperature treatment at 0°C. (B) RD29A::LUC expression after treatment with 100 μM abscisic acid. (C) RD29A::LUC expression after treatment with 300 mM NaCl. RD29A::LUC expression was quantified as luminescence intensity. ABA, abscisic acid; WT, wild type.
Figure 3.
Figure 3.
Gene Expression in Wild-Type and fro1 Mutant Plants in Response to Stress Treatments. (A) and (C) RNA gel blot hybridization with total RNA (20 μg) from wild-type and fro1 mutant seedlings treated with low temperature (0°C) for the indicated times, abscisic acid (100 μM) for 3 h, or NaCl (300 mM) for 5 h. Gene probes used for RNA gel blot hybridization are indicated at left. (B) RNA gel blot hybridization with total RNA (20 μg) from seedlings treated with low temperature (0°C) for either 0 or 72 h. 25S rRNA and tubulin were used as loading controls. ABA, abscisic acid; WT, wild type.
Figure 4.
Figure 4.
Water-Soaked Leaf Phenotype of fro1 Mutant Plants. (A) Two-week-old wild-type plant grown at 22°C. Bar = 5 mm. (B) Two-week-old wild-type plant after 4 h of freezing treatment at −10°C followed by 24 h of incubation at 4°C. Bar = 5 mm. (C) Frozen wild-type leaf magnified from (B). The arrow indicates a water-soaked region of the leaf. Bar = 2 mm. (D) Three-week-old fro1 mutant plant grown at 22°C. Bar = 5 mm.
Figure 5.
Figure 5.
Comparison of Ultrastructure between Wild-Type and fro1 Mutant Plants. (A), (C), (E), and (G) Wild-type leaves. Chloroplasts (E) and mitochondria (G) are shown. (B), (D), (F), and (H) fro1 mutant leaves. Chloroplasts (F) and mitochondria (H) are shown. White arrows indicate the irregular cell shape in fro1. Asterisks indicate intercellular spaces. WT, wild type. Bars = 20 μm for (A) and (B), 10 μm for (C) and (D), 1 μm for (E) and (F), and 0.5 μm for (G) and (H).
Figure 6.
Figure 6.
Constitutive Leakiness and Cold Acclimation Defect in fro1 Plants. (A) Electrolyte leakage in wild-type and fro1 leaves from whole plants without stress or with treatment at 4°C for 3 days or at −1°C for 1 day. (B) Electrolyte leakage at different temperatures. For cold acclimation, seedlings were incubated under light at 4°C for 2 days before the test. CA-fro1, cold-acclimated fro1; CA-WT, cold-acclimated wild type; WT, wild type.
Figure 7.
Figure 7.
Detection of ROS in fro1 Leaves. (A) and (B) NBT staining for superoxide in unstressed leaves of wild-type (A) and fro1 (B) plants. (C) and (D) NBT staining for superoxide in cold-treated (4°C for 2 days) leaves of wild-type (C) and fro1 (D) plants. Staining is shown as dark blue. (E) and (F) DAB staining for hydrogen peroxide in unstressed leaves of wild-type (E) and fro1 (F) plants. (G) and (H) DAB staining for hydrogen peroxide of cold-treated (4°C for 2 days) leaves of wild-type (G) and fro1 (H) plants. Staining is shown as dark yellow. Dark yellow spots representing DAB staining in the wild type are shown in the inset in (G). WT, wild type.
Figure 8.
Figure 8.
Difference in Growth and Development Rates between Wild-Type and fro1 Mutant Plants. (A) Difference in organ appearance after germination (n = 10). (B) Twenty-day-old wild-type (top) and fro1 (bottom) plants. Bar = 2 cm. (C) Thirty-day-old wild-type (left) and fro1 (right) plants. Bar = 5 cm. (D) Seven-week-old wild-type (left) and fro1 (right) plants. (E) Eight-week-old wild-type (left) and fro1 (right) plants. Bar = 5 cm. WT, wild type.
Figure 9.
Figure 9.
Effect of Osmotic Stress on Seed Germination in fro1 and the Wild Type. Germination ratio of the wild type and fro1 on filter papers saturated with different concentrations of Suc (A), mannitol (B), Glc (C), and NaCl (D). A clear appearance of the radicle was considered as germination, which was scored on day 4 after incubation at room temperature. WT, wild type.
Figure 10.
Figure 10.
Map-Based Cloning of FRO1 and Molecular Complementation of fro1 Mutants. (A) Markers are SSLP markers except for K8K14-C1, which is a cleaved amplified polymorphic sequence marker. The number of recombinant chromosomes/number of total chromosomes examined at each locus is indicated. The FRO1 gene structure was obtained by comparing its cDNA sequence with the genomic sequence. Black boxes indicate exons, and solid lines between boxes indicate introns. The position of the fro1 mutation is indicated. cM, centimorgan. (B) Morphological comparison between wild type (WT), fro1, and fro1 transformed with FRO1 (fro1+FRO1; T1 generation) at the same developmental stage (5 weeks old). (C) and (D) Morphology (C) and luminescence (D) of wild-type (WT) and fro1 seedlings of a segregating T2 population from fro1 transformed with FRO1 (fro1+FRO1).
Figure 11.
Figure 11.
Amino Acid Alignment between FRO1 and Its Homolog from Bos taurus. (A) and (B) Alignment between predicted mitochondrial targeting sequences (A) and mature proteins after the targeting sequences are cleaved (B). Amino acid sequence alignment was performed with ClustalW (http://dot.imgen.bcm.tmc.edu:9331/multialign/Options/clustalw.html). Identical amino acids are highlighted in black, and conservative substitutions are highlighted in gray. (C) FRO1 expression in wild-type and fro1 mutant plants. Seedlings were treated with low temperature (0°C) for the indicated times, abscisic acid (100 μM) for 3 h, and NaCl (300 mM) for 5 h. Tubulin was used as a loading control. ABA, abscisic acid; WT, wild type.
Figure 12.
Figure 12.
Subcellular Localization of FRO1:GFP. (A) to (C) Green fluorescence from root tissues of Arabidopsis plants transformed with FRO1:GFP was detected using a confocal microscope. Before confocal imaging, seedlings were subjected to the following treatments: no stress (A), cold stress at 0°C for 12 h (B), or cold stress at 0°C for 24 h (C). (D) Green fluorescence from root tissue of mitochondria-targeted Arabidopsis β-ATPase:GFP (Logan and Leaver, 2000) is shown as a positive control.

References

    1. Alvarez, M.E., Pennell, R.I., Meijer, P.J., Ishikawa, A., Dixon, R.A., and Lamb, C. (1998). Reactive oxygen intermediates mediate a systemic signal network in the establishment of plant immunity. Cell 92, 773–784. - PubMed
    1. Artus, N.N., Uemura, M., Steponkus, P.L., Gilmour, S.J., Lin, C.T., and Thomashow, M.F. (1996). Constitutive expression of the cold-regulated Arabidopsis thaliana COR15a gene affects both chloroplast and protoplast freezing tolerance. Proc. Natl. Acad. Sci. USA 93, 13404–13409. - PMC - PubMed
    1. Baker, S.S., Wilhelm, K.S., and Thomashow, M.F. (1994). The 5′-region of Arabidopsis thaliana COR15a has cis-acting elements that confer cold-regulated, drought-regulated and ABA-regulated gene expression. Plant Mol. Biol. 24, 701–713. - PubMed
    1. Bell, C.J., and Ecker, J.R. (1994). Assignment of 30 microsatellite loci to the linkage map of Arabidopsis. Genomics 19, 137–144. - PubMed
    1. Biswas, G., Adebanjo, O.A., Freedman, B.D., Anandatheerthavarada, H.K., Vijayasarathy, C., Zaidi, M., Kotlikoff, M., and Avadhani, N.G. (1999). Retrograde Ca2+ signaling in C2C12 skeletal myocytes in response to mitochondrial genetic and metabolic stress: A novel mode of inter-organelle crosstalk. EMBO J. 18, 522–533. - PMC - PubMed

Publication types

MeSH terms

Associated data