. 2002 Jun;14(6):1279-91.
doi: 10.1105/tpc.000653.

Dark-stimulated calcium ion fluxes in the chloroplast stroma and cytosol

Affiliations

Dark-stimulated calcium ion fluxes in the chloroplast stroma and cytosol

Jiqing Sai et al. Plant Cell. 2002 Jun.

Abstract

Using transgenic Nicotiana plumbaginifolia seedlings in which the calcium reporter aequorin is targeted to the chloroplast stroma, we found that darkness stimulates a considerable flux of Ca(2+) into the stroma. This Ca(2+) flux did not occur immediately after the light-to-dark transition but began approximately 5 min after lights off and increased to a peak at approximately 20 to 30 min after the onset of darkness. Imaging of aequorin emission confirmed that the dark-stimulated luminescence emanated from chloroplast-containing tissues of the seedling. The magnitude of the Ca(2+) flux was proportional to the duration of light exposure (24 to 120 h) before lights off; the longer the duration of light exposure, the larger the dark-stimulated Ca(2+) flux. On the other hand, the magnitude of the dark-stimulated Ca(2+) flux did not appear to vary as a function of circadian time. When seedlings were maintained on a 24-h light/dark cycle, there was a stromal Ca(2+) burst after lights off every day. Moreover, the waveform of the Ca(2+) spike was different during long-day versus short-day light/dark cycles. The dark-stimulated Ca(2+) flux into the chloroplastidic stroma appeared to affect transient changes in cytosolic Ca(2+) levels. DCMU, an inhibitor of photosynthetic electron transport, caused a significant increase in stromal Ca(2+) levels in the light but did not affect the magnitude of the dark-stimulated Ca(2+) flux. This robust Ca(2+) flux likely plays regulatory roles in the sensing of both light/dark transitions and photoperiod.


Figures

Figure 1.
Figure 1.
Luminescence from Reconstituted Aequorin in Nicotiana plumbaginifolia Seedlings Expressing Aequorin That Has Been Targeted to the Chloroplast Stroma (MAQ 6.3). Seedlings were in LL (22 μE·m−2·s−1) until the time of transfer to DD (white bars along abscissa indicate LL, and black bars indicate DD). (A) Comparison of dark-stimulated luminescence from MAQ 6.3 seedlings (open circles) and nontransgenic wild-type seedlings (closed circles). Both MAQ 6.3 and wild-type seedlings were incubated in coelenterazine; transition to DD was at 111.7 h after the beginning of LL. There were 10 seedlings per vial, and seedlings were 10 days old. (B) to (D) Three independent sets of MAQ 6.3 seedlings transferred from LL to DD at 120 h. There were five seedlings per vial, and seedlings were 22 days old. (C) and (D) are redrawn from Johnson et al. (1995).
Figure 4.
Figure 4.
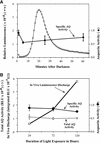
Comparison of Luminescence of MAQ 6.3 Seedlings with Total Apo-Aequorin Activity at Different Times. (A) Relative apo-aequorin activity during the first hour after the transfer from LL to DD. Seedlings had been in LL for 5 days (22 μE·m−2·s−1) before transfer to darkness. Left ordinate and open squares show in vivo luminescence of seedlings (in relative light units [RLU]); the abscissa shows time after the LL-to-DD transition in minutes. (B) Apo-aequorin activity of seedlings that had been exposed to different durations of previous light exposure (22 μE·m−2·s−1). Left ordinate and open squares show in vivo luminescence of seedlings integrated for every minute for 90 min; left ordinate and open circles show total apo-aequorin activity of each sample extracted and assayed as for specific apo-aequorin activity (total activity, not normalized to protein concentration); the abscissa shows the duration of light exposure before the LL-to-DD transition; right ordinates and closed symbols show specific activity of apo-aequorin (normalized to protein concentration) extracted at the times indicated from seedlings under the same conditions as in the samples used for luminescence recordings. Extracted samples (both total and specific) were prepared in triplicate, and apo-aequorin activity was measured in extracts as described in Methods. Error bars indicate standard error of mean. AQ, apo-aequorin; RLU, relative light units.
Figure 2.
Figure 2.
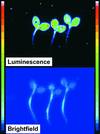
Imaging of Luminescence from Three MAQ 6.3 Seedlings. The top shows luminescence emission from seedlings after transfer from LL (5 days at 22 μE·m−2·s−1) to DD. The image shown represents an integration of the light emission during the first 30 min after the LL-to-DD transition. Integrations from 30 to 60 min and from 60 to 90 min showed the same distribution, but the intensity of luminescence was lower. The bottom shows images of the same seedlings in a bright field (i.e., under room lighting) to indicate the full size of the seedlings. The resolution of the bright-field images is not optimal; for example, the relative widths of the hypocotyls and rootlets are larger in the image than in reality. The color bars on both sides are the pseudocolor scales, with dark blue being dimmest and white being brightest.
Figure 3.
Figure 3.
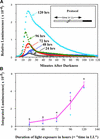
The Magnitude of the Ca2+ Spike into Chloroplasts Is Proportional to the Duration of Light Exposure before the LL-to-DD Transition. (A) Relative luminescence immediately after the LL-to-DD transition as a function of the duration of light exposure from 24 to 120 h (time 0 is the time of the transition). The protocol is shown in the inset. Light intensity was 22 μE·m−2·s−1. (B) Integration of the luminescence from 0 to 90 min after the LL-to-DD transition as a function of the duration of previous LL treatments for three separate experiments, including the one shown in (A). Integrated luminescence was calculated as the cumulative light emitted during 90 min as measured in 1-min bins and added together. The solid line represents the mean from the three individual experiments, and error bars indicate standard error of mean.
Figure 5.
Figure 5.
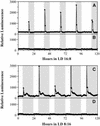
Stromal Ca2+ Spikes Occur after Lights Off in 24-h Light/Dark Cycles. (A) and (B) Long-day cycles (LD 16:8). (C) and (D) Short-day cycles (LD 8:16). Gray areas indicate dark intervals, and white areas indicate illuminated intervals. Light Intensity was 22 μE·m−2·s−1. MAQ 6.3 seedlings were monitored in (A) and (C), whereas nontransgenic wild-type seedlings were monitored in (B) and (D). Both the transgenic and nontransgenic seedlings were treated with coelenterazine. These data are representative traces for two separate experiments for each photoperiod with four to five replicates for each condition.
Figure 6.
Figure 6.
Ca2+ Flux into Chloroplast Stroma as a Function of Circadian Time. Seedlings were germinated and grown in LD 16:8 until the time of treatment with coelenterazine, as described in Methods. After the 8-h treatment with coelenterazine in DD, the seedlings were transferred to LL. The protocol from the onset of LL was as shown in the inset: MAQ 6.3 seedlings were maintained in LL for 5 days (22 μE·m−2·s−1), after which they were transferred to DD at different phases of the circadian cycle. The ordinate plots the integrated luminescence (0 to 90 min after the LL-to-DD transition) for four separate experiments, and the abscissa shows the circadian time (CT) of the transfer to darkness (time 0 is subjective dawn, which is the time of transfer in the experiments depicted in Figures 1 to 4). The solid line connects the averages, and the error bars indicate standard error of mean. The large variation at circadian time 8 was caused by one outlying point.
Figure 7.
Figure 7.
Comparison of Luminescence Profiles of Stroma-Targeted (MAQ 6.3) versus Cytosol-Targeted (MAQ 2.4) Aequorin. The ordinate shows relative luminescence, and the abscissa shows time in hours. The LL-to-DD transition occurred between 119 and 120 h, as shown by the black bar. Data are representative traces from three separate experiments in which matched sets of MAQ 2.4 versus MAQ 6.3 seedlings were compared (n = 8 for MAQ 2.4, n = 12 for MAQ 6.3).
Figure 9.
Figure 9.
Model for Ca2+ Fluxes into and out of the Chloroplast Modulated by Light and Dark. Relatively high concentrations of Ca2+ and strong Ca2+ fluxes are shown with thick red lines, and relatively low concentrations of Ca2+ and weak Ca2+ fluxes are shown with thin blue lines. The source of Ca2+ that is discharged by darkness is a hypothetical calcium store. This calcium store is shown with dashed lines because it is not known (1) whether it is in the stromal lumen or the thylakoid, and (2) whether it is membrane bound (e.g., if it is identical with the thylakoid). Calcium stores in the cytosol and extracellular space are not shown, but they certainly are involved in the regulation of cytosolic calcium. ap, Ca2+/H+ antiporter; LR, light-regulated Ca2+ uptake into chloroplasts; pet, photosynthetic electron transport; thy, thylakoid lumen.
Figure 8.
Figure 8.
DCMU Promotes a Light-Dependent Increase of Ca2+ in the Stroma but Does Not Inhibit the Dark-Stimulated Ca2+ Flux in LD 16:8. DCMU or MS medium was added to MAQ 6.3 seedlings at h 44 of LD 16:8. A total of 200 μL of MS medium or of 100 μM DCMU (dissolved in MS medium) was added on top of seedlings on 2 mL of agar medium. The final DCMU concentration after diffusion into the agar medium was 10 μM. (C) and (D) show magnified versions of (A) and (B) ([C] is magnified from [A] and [D] is magnified from [B]). Representative traces are shown for measurements from 18 different samples for each treatment (two separate experiments with three DCMU treatments at 2 μM, three DCMU treatments at 10 μM, and three medium treatments in each experiment). To ensure that the signal observed with DCMU was specific for stroma-targeted aequorin (and not for, e.g., delayed fluorescence [Jursinic, 1986]), we also treated nontransgenic seedlings that had been incubated with coelenterazine and treated with DCMU. In those seedlings, there was no increase in basal luminescence levels after DCMU treatment, nor was there a dark-stimulated luminescence burst.

Similar articles

Cited by

References

    1. Becker, D.W., Callahan, F.E., and Cheniae, G.M. (1985). Photoactivation of NH2OH-treated leaves: Reassembly of released extrinsic PSII polypeptides and religation of Mn into the polynuclear Mn catalyst of water oxidation. FEBS Lett. 192, 209–214.
    1. Bush, D.S. (1993). Regulation of cytosolic calcium in plants. Plant Physiol. 103, 7–13. - PMC - PubMed
    1. Bush, D.S. (1995). Calcium regulation in plant cells and its role in signaling. Annu. Rev. Plant Physiol. Plant Mol. Biol. 46, 95–122.
    1. Colwell, C.S. (2000). Circadian modulation of calcium levels in cells in the suprachiasmatic nucleus. Eur. J. Neurosci. 12, 571–576. - PMC - PubMed
    1. Demmig, B., and Gimmler, H. (1979). Effect of divalent cations on cation fluxes across the chloroplast envelope and on photosynthesis of intact chloroplasts. Z. Naturforsch. 34c, 233–241.

Publication types

LinkOut - more resources