. 2002 Jun;14(6):1293-309.
doi: 10.1105/tpc.001586.

Membrane protein transport between the endoplasmic reticulum and the Golgi in tobacco leaves is energy dependent but cytoskeleton independent: evidence from selective photobleaching

Affiliations

Membrane protein transport between the endoplasmic reticulum and the Golgi in tobacco leaves is energy dependent but cytoskeleton independent: evidence from selective photobleaching

Federica Brandizzi et al. Plant Cell. 2002 Jun.

Abstract

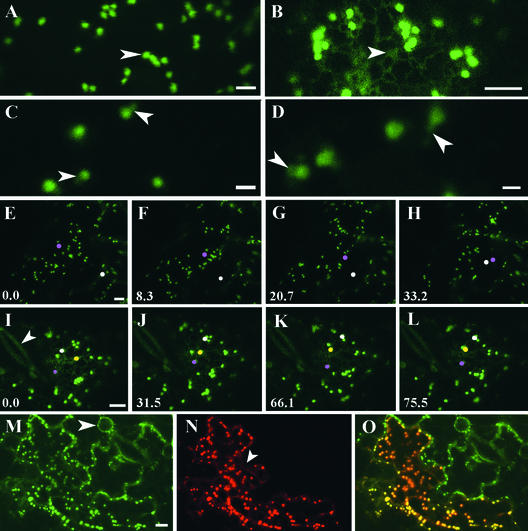
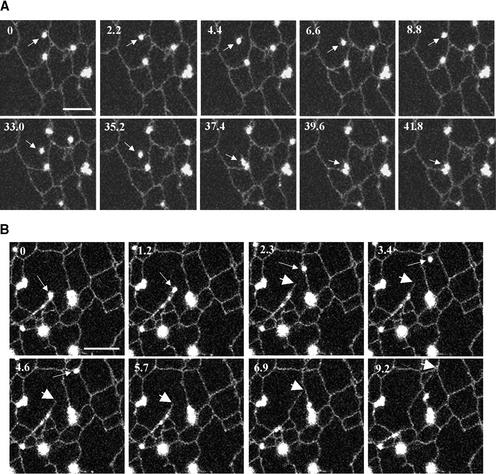
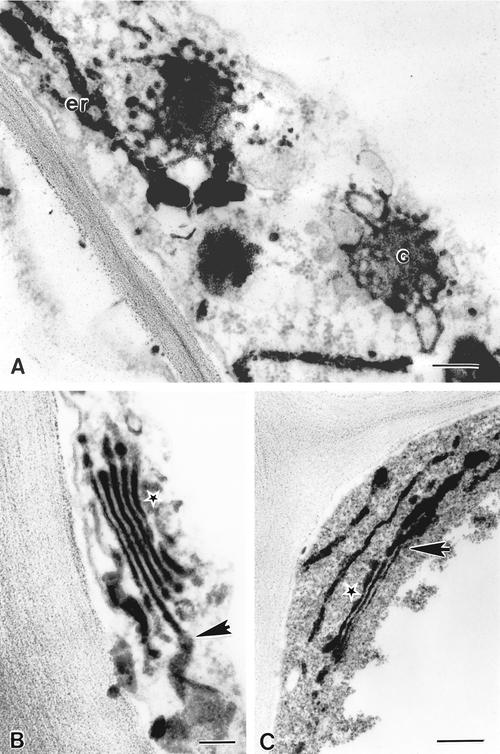
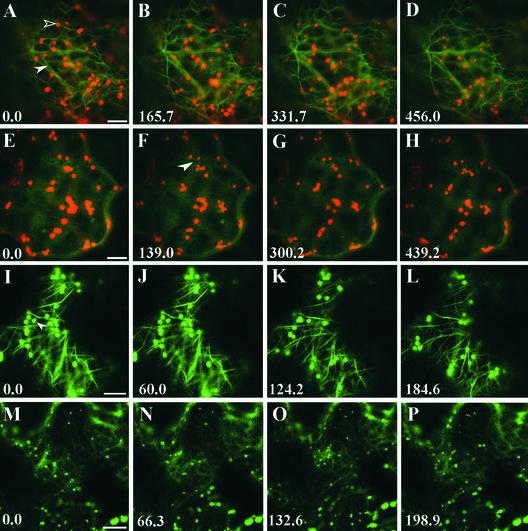
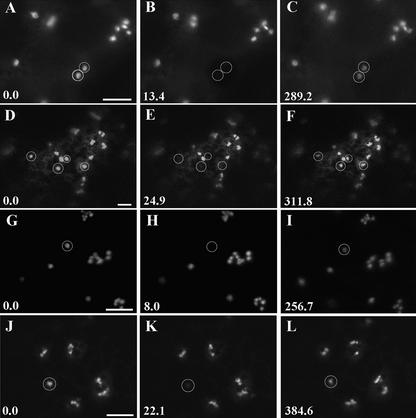
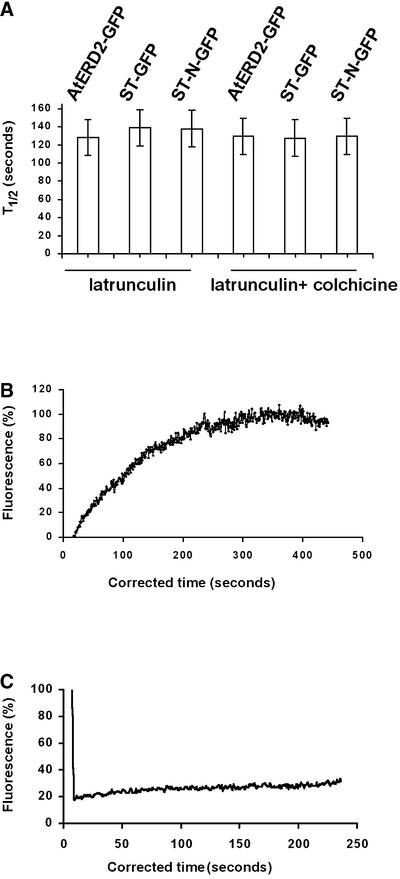
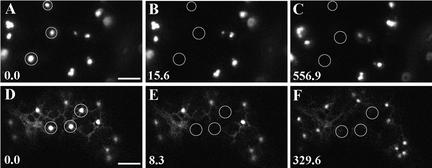
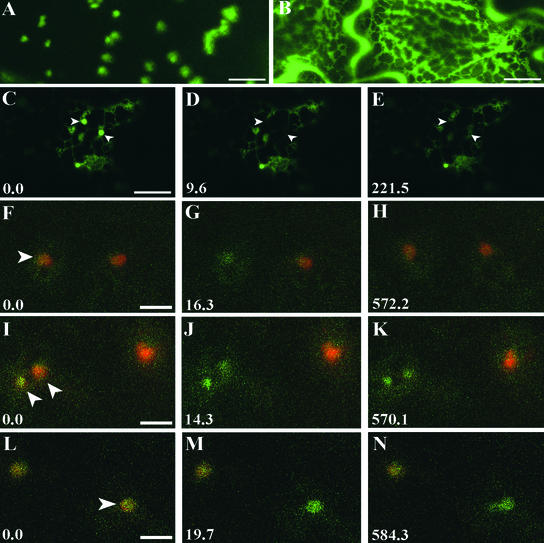
The mechanisms that control protein transport between the endoplasmic reticulum (ER) and the Golgi apparatus are poorly characterized in plants. Here, we examine in tobacco leaves the structural relationship between Golgi and ER membranes using electron microscopy and demonstrate that Golgi membranes contain elements that are in close association and/or in direct contact with the ER. We further visualized protein trafficking between the ER and the Golgi using Golgi marker proteins tagged with green fluorescent protein. Using photobleaching techniques, we showed that Golgi membrane markers constitutively cycle to and from the Golgi in an energy-dependent and N-ethylmaleimide-sensitive manner. We found that membrane protein transport toward the Golgi occurs independently of the cytoskeleton and does not require the Golgi to be motile along the surface of the ER. Brefeldin A treatment blocked forward trafficking of Golgi proteins before their redistribution into the ER. Our results indicate that in plant cells, the Golgi apparatus is a dynamic membrane system whose components continuously traffic via membrane trafficking pathways regulated by brefeldin A- and N-ethylmaleimide-sensitive machinery.


Figures

Figure 1.
Figure 1.
ST- and AtERD2-Fluorescent Markers Label the Same Highly Mobile Population of Golgi Stacks. (A) In ST-GFP–transformed epidermal tobacco cells, fluorescent Golgi stacks are visible (arrowhead). Bar = 5 μm. (B) Fluorescent Golgi stacks also are visible in AtERD2-GFP–transformed epidermal cells. The ER network is visible in these cells (arrowhead). Bar = 5 μm. (C) and (D) At higher magnification, wide-open pinhole, and no averaging microscope settings, structures elongating from Golgi stacks are visible (arrowheads) in tobacco cells expressing ST-GFP ([C]; bar = 2 μm) and AtERD2-GFP ([D]; bar = 1 μm). (E) to (H) Golgi stacks appear highly mobile. In an epidermal cell expressing ST-GFP, the color of two Golgi bodies has been digitally superimposed with pink and white to allow their movement to be followed within a cell in a time lapse. Time is expressed in seconds at the bottom left of each frame. Bar = 5 μm. (I) to (L) Time lapse of a tobacco epidermal cell transformed with AtERD2-GFP near a pair of untransformed guard cells ([I], arrowhead). The color of three Golgi bodies has been digitally superimposed with white, yellow, and pink to allow the movement of the stacks to be followed within the cell. Time is expressed in seconds at the bottom left of each frame. Bar = 5 μm. (M) to (O) Images of a tobacco epidermal cell transformed with ST-GFP and AtERD2-YFP taken with different excitation/emission microscope configurations specific for imaging the two fluorochromes independently. Bar = 5 μm. (M) Image taken with GFP settings showing the Golgi in cells transformed with ST-GFP. In transiently expressing ST-GFP cells, nuclear envelopes rarely are visible (arrowhead). (N) Same frame as in (M) imaged with YFP settings showing an AtERD2-YFP. The ER network underlying the Golgi stacks is visible (arrowhead). (O) Merged (M) and (N) images. Colocalization of GFP and YFP is visible as orange-yellow.
Figure 2.
Figure 2.
Time Lapse of an AtERD2-GFP Expressed in a N. clevelandii Leaf Trichome by Virus-Mediated Transient Expression. (A) A Golgi body can be seen breaking free from the ER (arrows). A tubular membrane, probably originating from the ER, is visible (arrows in bottom row). (B) A Golgi body (small arrows) appears to drag the ER tubules (large arrows) along the same trajectory. Time is expressed in seconds at the top left of each frame. Bars = 5 μm.
Figure 3.
Figure 3.
Electron Micrographs of Zinc Iodide– and Osmium Tetroxide–Impregnated Cells Show the Closeness of the Golgi and the ER. (A) Conventional transmission electron micrograph of the ER (er) and the Golgi (G) after impregnation. (B) and (C) Golgi stacks appear to have points in continuity with the ER (arrows). Star indicates the trans face of the Golgi. Bars = 500 nm.
Figure 4.
Figure 4.
Golgi Stack Movement Requires the Actin Cytoskeleton and Occurs Independently of the Presence of Microtubules. (A) to (D) Time lapse of a cell cotransformed with talin-GFP and ST-YFP. Golgi stacks (open arrowhead) align on actin cables (closed arrowhead). The actin network appears to be highly mobile. Bar = 5 μm. (E) to (H) One hour of latrunculin B treatment (25 μM) induces actin depolymerization and cytoplasmic release of the talin-GFP construct. Cytoplasmic organelles are visible in negative contrast ([F], arrowhead). Golgi movement is inhibited strongly after 1 h of latrunculin B treatment. Compare the time sequence (A) to (D) with (E) to (F) and note that the Golgi stacks in (E) to (H) are relatively immobile compared with those in (A) to (D) within similar time frames. Bar = 5 μm. (I) to (L) Time lapse of an epidermal cell cotransformed with a tubulin-GFP construct and ST-GFP. Golgi stacks are mostly independent of the microtubule cytoskeleton ([I], arrowhead). Bar = 5 μm. (M) to (P) Depolymerization of microtubules with the drug colchicine does not prevent Golgi stacks from moving. This time series was taken after 1 h of treatment with 1 mM colchicine. Bar = 10 μm. Time is expressed in seconds at the bottom left of each frame.
Figure 5.
Figure 5.
The Recovery of Fluorescence into Photobleached Golgi Stacks Does Not Require Actin or Microtubules. (A) to (C) Two Golgi stacks (circles) labeled with ST-GFP (A) were photobleached (B) after treatment with the actin agent latrunculin B. After bleaching, the fluorescence recovered (C). (D) to (F) Four Golgi stacks in an AtERD2-GFP–transformed epidermal cell ([D], circles) were photobleached (E) after latrunculin B treatment. Fluorescence recovered in the stacks (F). (G) to (I) ST-GFP Golgi in an epidermal cell ([G], circle) treated with latrunculin B and the microtubule-depolymerizing agent colchicine (I) recovered after bleaching (H). (J) to (L) The fluorescence of AtERD2-GFP Golgi ([J], circle) in latrunculin B– and colchicine-treated transformed epidermal cells (L) recovered after bleaching (K). Time is expressed in seconds at the bottom left of each frame. Bars = 5 μm.
Figure 6.
Figure 6.
Fluorescence Half-Time Recoveries and Curves. (A) The time of fluorescence recovery into photobleached Golgi stacks is similar in the absence of microtubules and/or actin for proteins with different locations in the Golgi and different glycosylation states. Data represent means ± sd (n ≥ 25) and were significant at P = 0.05. (B) Example of a half-time recovery plot. One hundred percent fluorescence indicates the prebleach fluorescence intensity. (C) Representative fluorescence recovery curve of bleached Golgi in ATP-depleted cells expressed as a percentage of the initial fluorescence versus time.
Figure 7.
Figure 7.
Recovery of Fluorescence into Photobleached Golgi Stacks Is ATP and Protein Dependent. (A) to (C) Golgi stacks in an AtERD2-GFP–transformed epidermal cell. Golgi stacks ([A], circles) were bleached (B), and their fluorescence failed to recover in the presence of ATP depletors (C). (D) to (F) Golgi bodies ([D], circles) were bleached (E) in a cell treated with the protein cross-linker NEM (20 mM) for 15 min. The fluorescence did not recover under these conditions (F). Time is expressed in seconds at the bottom left of each frame. Bars = 5 μm.
Figure 8.
Figure 8.
Analysis of the Effect of the Secretory Inhibitor BFA. (A) Golgi stacks in an epidermal cell transformed with ST-GFP. (B) Addition of BFA causes reabsorption of the Golgi membranes in the ER within 1 h of treatment. (C) and (D) Photobleaching (D) of Golgi stacks ([C], arrowheads) in an AtERD2-transformed epidermal cell treated with cytochalasin D (20 μg/mL for 30 min) and BFA. No fluorescence was recovered by 220 s after bleaching. The bleaching experiment started at 20 min after the addition of BFA (E). Bar = 5 μm. (F) to (H) Golgi ([F], arrowhead) of epidermal cells treated with latrunculin cotransformed with AtERD2-CFP (green) and AtERD2-YFP (red) were photobleached of the YFP fluorescence (G). Fluorescence recovery was observed (H). Bar = 2 μm. (I) to (K) Fluorescence of photobleached (J) AtERD2-YFP Golgi stacks ([I], arrowheads) in cells treated with latrunculin and BFA did not recover (K). The bleaching experiment started at 30 min after the addition of BFA. Bar = 2 μm. (L) to (N) Photobleached (M) ST-YFP Golgi ([L], arrowhead) in epidermal cells cotransformed with ST-CFP (green) in the presence of latrunculin and BFA did not recover (N). The bleaching experiment started at 25 min after the addition of BFA. Bar = 2 μm. Time is expressed in seconds at the bottom left of each frame.

Similar articles

Cited by

References

    1. Andreeva, A.V., Kutuzov, M.A., Evans, D.E., and Hawes, C.R. (1997). Rab-GDP dissociation inhibitor isoforms in Arabidopsis thaliana. J. Exp. Bot. 48, 2109–2110.
    1. Andreeva, A.V., Zheng, H., Saint-Jore, C.M., Kutuzov, M.A., Evans, D.E., and Hawes, C.R. (2000). Organization of transport from endoplasmic reticulum to Golgi in higher plant. Biochem. Soc. Trans. 28, 505–512. - PubMed
    1. Aridor, M., and Balch, W.E. (2000). Kinase signaling initiates coat complex II (COPII) recruitment and export from the mammalian endoplasmic reticulum. J. Biol. Chem. 275, 35673–35676. - PubMed
    1. Baldwin, T.C., Handford, M.G., Yuseff, M.-I., Orellana, A., and Dupree, P. (2001). Identification and characterization of GONST1, a Golgi-localized GDP-mannose transporter in Arabidopsis. Plant Cell 13, 2283–2295. - PMC - PubMed
    1. Barlowe, C. (2000). Traffic COPs of the early secretory pathway. Traffic 1, 371–377. - PubMed

Publication types

MeSH terms

LinkOut - more resources