. 2002 Jun 25;99(13):8518-23.
doi: 10.1073/pnas.142288399.

The rate-limiting step in the folding of a large ribozyme without kinetic traps

Affiliations

The rate-limiting step in the folding of a large ribozyme without kinetic traps

X-W Fang et al. Proc Natl Acad Sci U S A. .

Abstract

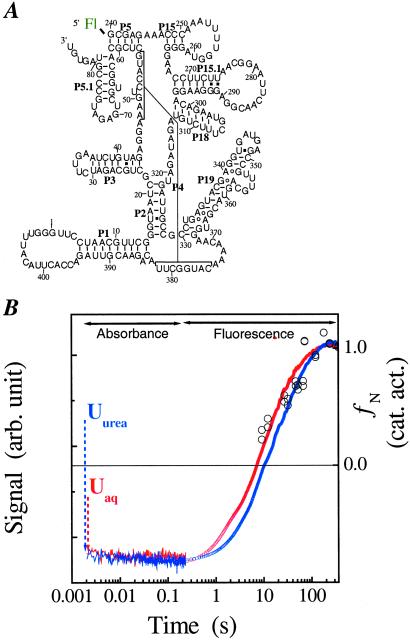
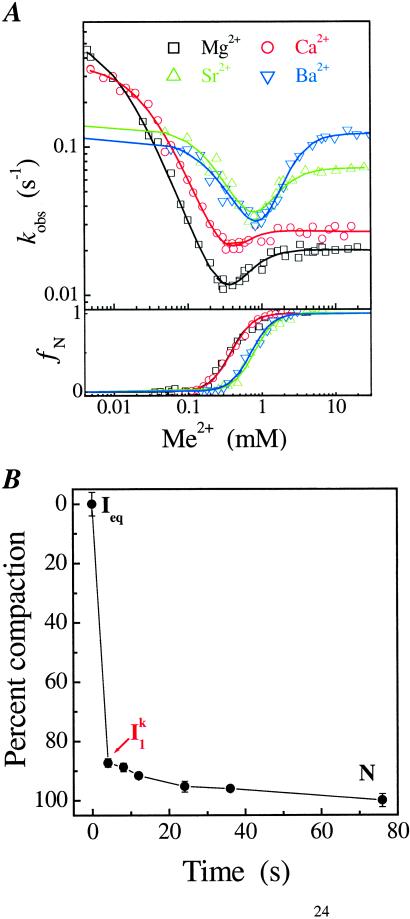
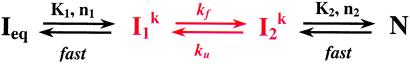
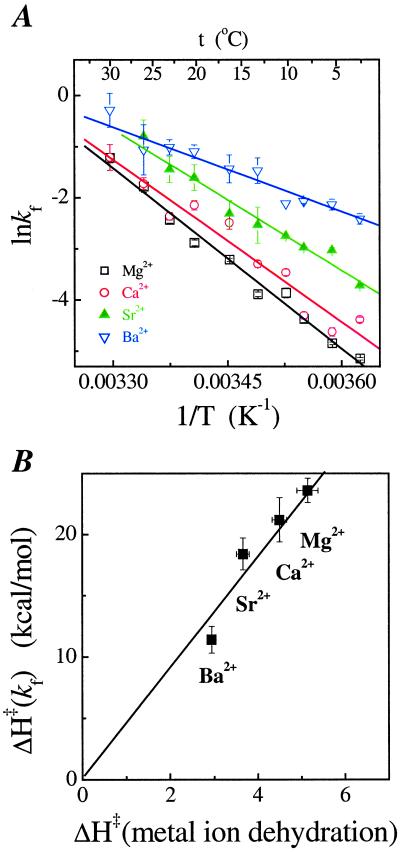
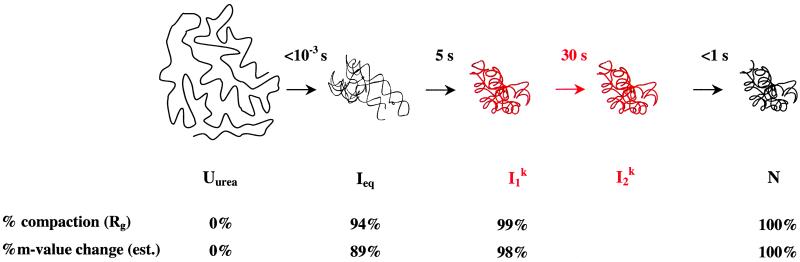
A fundamental question in RNA folding is the nature of the rate-limiting step. Folding of large RNAs often is trapped by the need to undo misfolded structures, which precludes the study of the other, potentially more interesting aspects in the rate-limiting step, such as conformational search, metal ion binding, and the role of productive intermediates. The catalytic domain of the Bacillus subtilis RNase P RNA folds without a kinetic trap, thereby providing an ideal system to elucidate these steps. We analyzed the folding kinetics by using fluorescence and absorbance spectroscopies, catalytic activity, and synchrotron small-angle x-ray scattering. Folding begins with the rapid formation of early intermediates wherein the majority of conformational search occurs, followed by the slower formation of subsequent intermediates. Before the rate-limiting step, more than 98% of the total structure has formed. The rate-limiting step is a small-scale structural rearrangement involving prebound metal ions.


Figures

Figure 1
Figure 1
(A) The B. subtilis C-domain (47). A fluorescein is covalently attached to the 5′ end that allows monitoring the folding kinetics by fluorescence spectroscopy. (B) Folding kinetics at 10°C starting from either the Uaq state (20 mM Tris⋅HCl, no Me2+) or the Uurea state (20 mM Tris⋅HCl, 8 M urea, 1 mM EDTA, no Me2+). Folding is monitored by absorbance from 0.002 to 0.2 s, and the dead-time change in signal is indicated with dashed arrows. Folding is monitored by fluorescence between 0.2 to 360 s. The fluorescence signal is fit with a two-exponential function. The slow phase has the same rate as that obtained by catalytic activity (open circles, right axis) and directly reports the rate-limiting step. The fast phase corresponds to the signal change of the Ieq-to-Iformula image transition and is ≈6 times faster than the slow phase.
Figure 2
Figure 2
(A) Metal-ion chevron analysis using fluorescence spectroscopy (Upper). In the chevron analysis, rate saturation at the high or low [Me2+] indicates the formation of a folding and unfolding intermediate, Iformula image and Iformula image, respectively. [Me2+] at the vertex of the chevron is approximately the same as the midpoint of the equilibrium Ieq-to-N transition measured independently (Lower). (B) Folding kinetics of C-domain from Ieq at 10 mM MgCl2, 10°C, monitored by SAXS. The percentage of compaction is calculated from radius gyration. This result indicates that Iformula image is highly compact and forms quickly.
Scheme 1
Scheme 1
Figure 3
Figure 3
(A) Temperature dependence of the folding rate. (B) Correlation between the activation enthalpy for folding and the dehydration of the metal ions measured by NMR (36).
Figure 4
Figure 4
Summary of C-domain folding. The rate-limiting step is shown in red. The folding half-lives at 10°C are shown, in seconds, above the arrows. The starting point is the Uurea state (C domain in 8 M urea and 1 mM EDTA), which has little RNA structure. Ieq contains the native amount of secondary structure and some tertiary structure. Iformula image contains >98% of the native structure. In less than 1 ms, the majority of the conformational search occurs with the formation of Ieq. All folding half-lives are measured in this work. Percent compaction is calculated from the data shown in Fig. 2B and from our previous work (31). Percent m-value change is calculated from published data (15).

References

    1. Cole P E, Crothers D M. Biochemistry. 1972;11:4368–4374. - PubMed
    1. Webb P K, Fresco J R. J Mol Biol. 1973;74:387–402. - PubMed
    1. Lynch D C, Schimmel P R. Biochemistry. 1974;13:1841–1852. - PubMed
    1. Zarrinkar P P, Williamson J R. Science. 1994;265:918–924. - PubMed
    1. Banerjee A R, Turner D H. Biochemistry. 1995;34:6504–6512. - PubMed

Publication types