

Leukemia inhibitory factor inhibits neuronal terminal differentiation through STAT3 activation
- PMID: 12084939
- PMCID: PMC124415
- DOI: 10.1073/pnas.132131699
Leukemia inhibitory factor inhibits neuronal terminal differentiation through STAT3 activation
Abstract
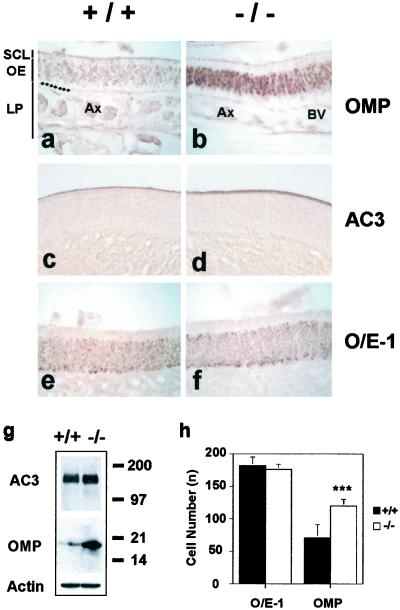
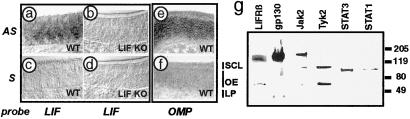
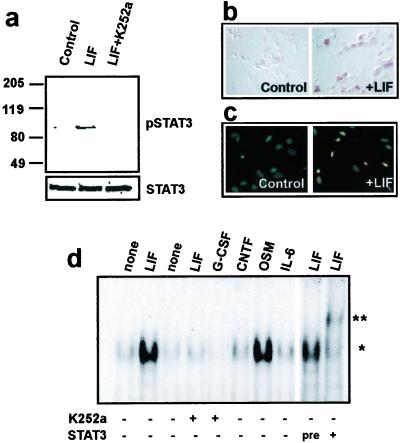
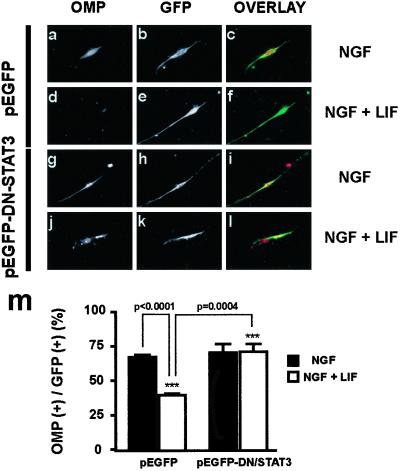
The discovery of stem cells in the adult central nervous system raises questions concerning the neurotrophic factors that regulate postnatal neuronal development. Olfactory receptor neurons (ORNs) are a useful model, because they are capable of robust neurogenesis throughout adulthood. We have investigated the role of leukemia inhibitory factor (LIF) in postnatal neuronal development by using ORNs as a model. LIF is a multifunctional cytokine implicated in various aspects of neuronal development, including phenotype determination, survival, and in response to nerve injury. LIF-deficient mice display significant increases, both in the absolute amount and in the number of cells expressing olfactory marker protein, a marker of mature ORNs. The maturation of ORNs was significantly inhibited by LIF in vitro. LIF activated the STAT3 pathway in ORNs, and transfection of ORNs with a dominant negative form of STAT3 abolished the effect of LIF. These findings demonstrate that LIF negatively regulates ORN maturation via the STAT3 pathway. Thus, LIF plays a critical role in controlling the transition of ORNs to maturity. Consequently, a population of ORNs is maintained in an immature state to facilitate the rapid repopulation of the olfactory epithelium with mature neurons during normal cell turnover or after injury.
Figures
Similar articles
-
Leukemia inhibitory factor mRNA expression is upregulated in macrophages and olfactory receptor neurons after target ablation.J Neurosci Res. 2002 Jan 15;67(2):246-54. doi: 10.1002/jnr.10090. J Neurosci Res. 2002. PMID: 11782968
-
Leukemia inhibitory factor-dependent transcriptional activation in embryonic stem cells.J Cell Biol. 1997 Sep 22;138(6):1207-17. doi: 10.1083/jcb.138.6.1207. J Cell Biol. 1997. PMID: 9298977 Free PMC article.
-
LIF-induced STAT3 signaling in murine versus human embryonal carcinoma (EC) cells.Exp Cell Res. 2002 Mar 10;274(1):119-29. doi: 10.1006/excr.2001.5454. Exp Cell Res. 2002. PMID: 11855863
-
Structural and functional studies on the leukemia inhibitory factor receptor (LIF-R): gene and soluble form of LIF-R, and cytoplasmic domain of LIF-R required for differentiation and growth arrest of myeloid leukemic cells.Leuk Lymphoma. 2000 May;37(5-6):517-25. doi: 10.3109/10428190009058503. Leuk Lymphoma. 2000. PMID: 11042511 Review.
-
The unsolved enigmas of leukemia inhibitory factor.Stem Cells. 2003;21(1):5-14. doi: 10.1634/stemcells.21-1-5. Stem Cells. 2003. PMID: 12529546 Review.
Cited by
-
Role of cytokine signaling during nervous system development.Int J Mol Sci. 2013 Jul 4;14(7):13931-57. doi: 10.3390/ijms140713931. Int J Mol Sci. 2013. PMID: 23880850 Free PMC article. Review.
-
Leukaemia inhibitory factor stimulates proliferation of olfactory neuronal progenitors via inducible nitric oxide synthase.PLoS One. 2012;7(9):e45018. doi: 10.1371/journal.pone.0045018. Epub 2012 Sep 14. PLoS One. 2012. PMID: 23024784 Free PMC article.
-
Exosomes released from neural progenitor cells and induced neural progenitor cells regulate neurogenesis through miR-21a.Cell Commun Signal. 2019 Aug 16;17(1):96. doi: 10.1186/s12964-019-0418-3. Cell Commun Signal. 2019. PMID: 31419975 Free PMC article.
-
Protective Functions of Reactive Astrocytes Following Central Nervous System Insult.Front Immunol. 2020 Sep 30;11:573256. doi: 10.3389/fimmu.2020.573256. eCollection 2020. Front Immunol. 2020. PMID: 33117368 Free PMC article. Review.
-
IGF-1 acts as controlling switch for long-term proliferation and maintenance of EGF/FGF-responsive striatal neural stem cells.Int J Med Sci. 2013;10(5):522-31. doi: 10.7150/ijms.5325. Epub 2013 Mar 13. Int J Med Sci. 2013. PMID: 23532711 Free PMC article.
References
-
- Doetsch F, Caille I, Lim D A, Garcia-Verdugo J M, Alvarez-Buylla A. Cell. 1999;97:703–716. - PubMed
-
- Gould E, Reeves A J, Graziano M S, Gross C G. Science. 1999;286:548–552. - PubMed
-
- Eriksson P S, Perfilieva E, Bjork-Eriksson T, Alborn A M, Nordborg C, Peterson D A, Gage F H. Nat Med. 1998;4:1313–1317. - PubMed
-
- Gage F H, Ray J, Fisher L J. Annu Rev Neurosci. 1995;18:159–192. - PubMed
Publication types
MeSH terms
Substances
LinkOut - more resources
Full Text Sources
Molecular Biology Databases
Miscellaneous
