

Use of fluorescent sequence-specific polyamides to discriminate human chromosomes by microscopy and flow cytometry
- PMID: 12087162
- PMCID: PMC117061
- DOI: 10.1093/nar/gkf406
Use of fluorescent sequence-specific polyamides to discriminate human chromosomes by microscopy and flow cytometry
Abstract
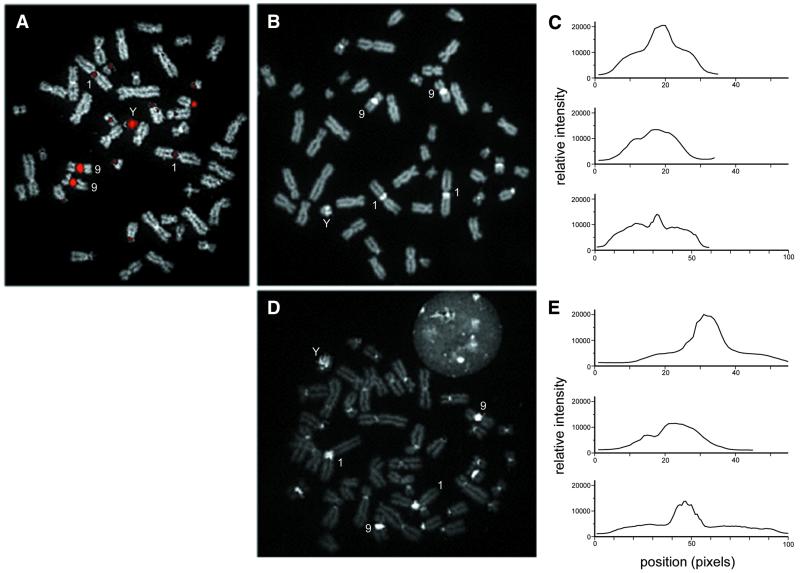
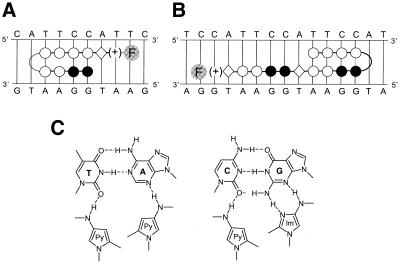
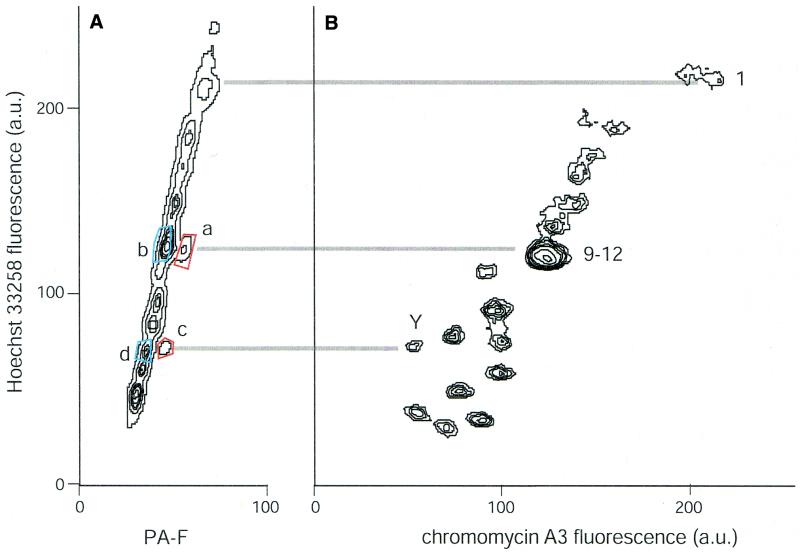
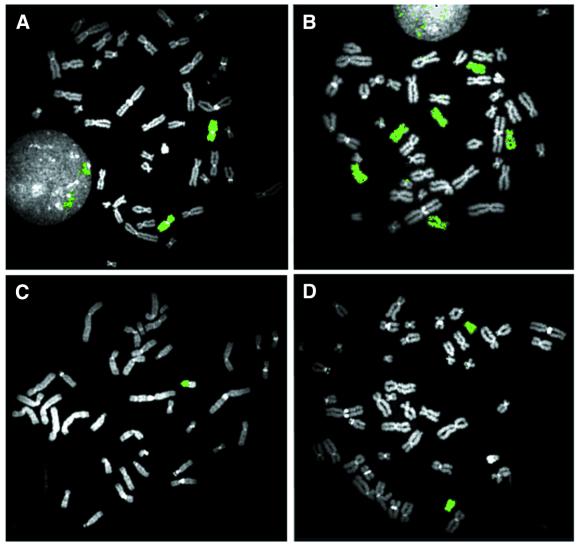
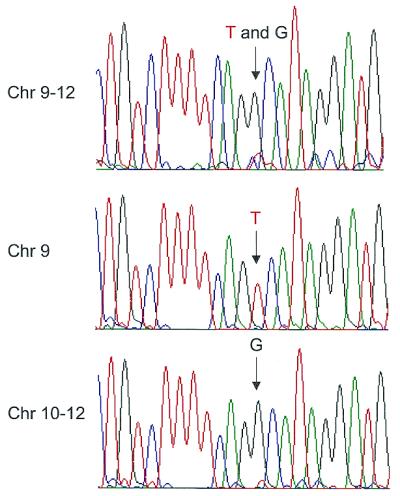
In this paper, we demonstrate the use of synthetic polyamide probes to fluorescently label heterochromatic regions on human chromosomes for discrimination in cytogenetic preparations and by flow cytometry. Polyamides bind to the minor groove of DNA in a sequence-specific manner. Unlike conventional sequence-specific DNA or RNA probes, polyamides can recognize their target sequence without the need to subject chromosomes to harsh denaturing conditions. For this study, we designed and synthesized a polyamide to target the TTCCA-motif repeated in the heterochromatic regions of chromosome 9, Y and 1. We demonstrate that the fluorescently labeled polyamide binds to its target sequence in both conventional cytogenetic preparations of metaphase chromosomes and suspended chromosomes without denaturation. Chromosomes 9 and Y can be discriminated and purified by flow sorting on the basis of polyamide binding and Hoechst 33258 staining. We generate chromosome 9- and Y-specific 'paints' from the sorted fractions. We demonstrate the utility of this technology by characterizing the sequence of an olfactory receptor gene that is duplicated on multiple chromosomes. By separating chromosome 9 from chromosomes 10-12 on the basis of polyamide fluorescence, we determine and differentiate the haplotypes of the highly similar copies of this gene on chromosomes 9 and 11.
Figures
Similar articles
-
The development of chromosome-specific composite DNA probes for the mouse and their application to chromosome painting.Chromosoma. 1993 Nov;102(9):591-8. doi: 10.1007/BF00352306. Chromosoma. 1993. PMID: 7508363
-
Sorting of chromosomes on FACSAria(TM) SORP for the preparation of painting probes.Cytometry A. 2016 Sep;89(9):844-51. doi: 10.1002/cyto.a.22934. Epub 2016 Aug 25. Cytometry A. 2016. PMID: 27560925
-
Generation of five high-complexity painting probe libraries from flow-sorted mouse chromosomes.Genomics. 1994 Jun;21(3):641-4. doi: 10.1006/geno.1994.1326. Genomics. 1994. PMID: 7959744
-
Genetic analysis by chromosome sorting and painting: phylogenetic and diagnostic applications.Eur J Hum Genet. 1997 Sep-Oct;5(5):253-65. Eur J Hum Genet. 1997. PMID: 9412781 Review.
-
Cytogenetic analysis by chromosome painting.Cytometry. 1994 Mar 15;18(1):2-10. doi: 10.1002/cyto.990180103. Cytometry. 1994. PMID: 8082483 Review.
Cited by
-
Programmable DNA-binding small molecules.Bioorg Med Chem. 2013 Oct 15;21(20):6101-14. doi: 10.1016/j.bmc.2013.04.023. Epub 2013 Apr 18. Bioorg Med Chem. 2013. PMID: 23665141 Free PMC article. Review.
-
High-speed chromosome sorting.Chromosome Res. 2004;12(1):5-14. doi: 10.1023/b:chro.0000009328.96958.a6. Chromosome Res. 2004. PMID: 14984097 Review.
-
Influence of structural variation on nuclear localization of DNA-binding polyamide-fluorophore conjugates.Nucleic Acids Res. 2004 May 20;32(9):2802-18. doi: 10.1093/nar/gkh609. Print 2004. Nucleic Acids Res. 2004. PMID: 15155849 Free PMC article.
-
Chromosomes in the flow to simplify genome analysis.Funct Integr Genomics. 2012 Aug;12(3):397-416. doi: 10.1007/s10142-012-0293-0. Epub 2012 Aug 16. Funct Integr Genomics. 2012. PMID: 22895700 Free PMC article. Review.
-
Invader probes: Harnessing the energy of intercalation to facilitate recognition of chromosomal DNA for diagnostic applications.Chem Sci. 2015 Aug 1;6(8):5006-5015. doi: 10.1039/C5SC01238D. Chem Sci. 2015. PMID: 26240741 Free PMC article.
References
-
- Harris P., Cooke,A., Boyd,E., Young,B.D. and Ferguson-Smith,M.A. (1987) The potential of family flow karyotyping for the detection of chromosome abnormalities. Hum. Genet., 76, 129–133. - PubMed
-
- Trask B., van den Engh,G., Nussbaum,R., Schwartz,C. and Gray,J. (1990) Quantification of the DNA content of structurally abnormal X chromosomes and X chromosome aneuploidy using high resolution bivariate flow karyotyping. Cytometry, 11, 184–195. - PubMed
Publication types
MeSH terms
Substances
LinkOut - more resources
Full Text Sources
Other Literature Sources
