. 2002 Jul 1;30(13):2920-9.
doi: 10.1093/nar/gkf414.

Analysis of cell-cycle gene expression in Saccharomyces cerevisiae using microarrays and multiple synchronization methods

Affiliations

Analysis of cell-cycle gene expression in Saccharomyces cerevisiae using microarrays and multiple synchronization methods

Kerby Shedden et al. Nucleic Acids Res. .

Abstract

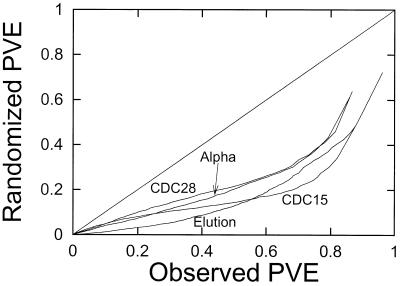
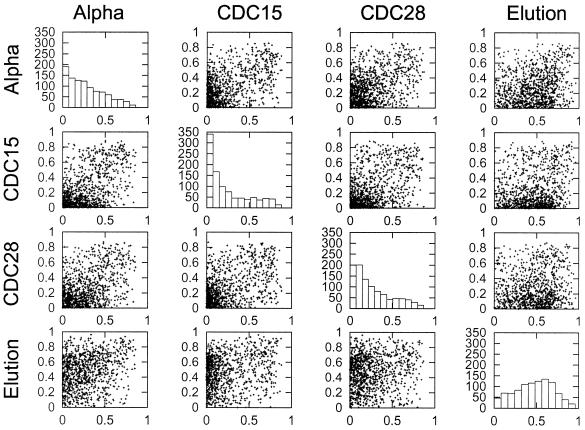
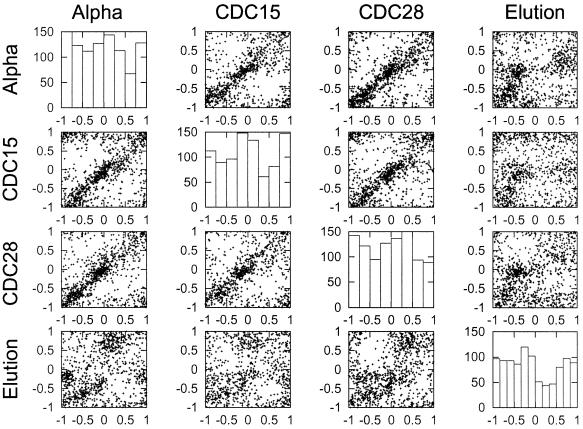
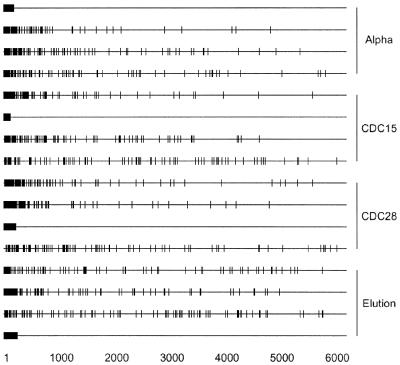
Microarray analysis of gene expression during the yeast division cycle has led to the proposal that a significant number of genes in Saccharomyces cerevisiae are expressed in a cell-cycle-specific manner. Four different methods of synchronization were used for cell-cycle analysis. Randomized data exhibit periodic patterns of lesser strength than the experimental data. Thus the cyclicities in the expression measurements in the four experiments presented do not arise from chance fluctuations or noise in the data. However, when the degree of cyclicity for genes in different experiments are compared, a large degree of non-reproducibility is found. Re-examining the phase timing of peak expression, we find that three of the experiments (those using alpha-factor, CDC28 and CDC15 synchronization) show consistent patterns of phasing, but the elutriation synchrony results demonstrate a different pattern from the other arrest-release synchronization methods. Specific genes can show a wide range of cyclical behavior between different experiments; a gene with high cyclicity in one experiment can show essentially no cyclicity in another experiment. The elutriation experiment, possibly being the least perturbing of the four synchronization methods, may give the most accurate characterization of the state of gene expression during the normal, unperturbed cell cycle. Under this alternative explanation, the observed cyclicities in the other three experiments are a stress response to synchronization, and may not reproduce in unperturbed cells.


Figures

Figure 1
Figure 1
Cyclicity of expression following different synchronization methods. For each experiment, the 1000 genes with the highest standard deviation in experimental values (using the raw data) were determined. For each of these 1000 genes the Fourier-PVE was calculated. These values were also determined for a randomized data set derived from the experimental values. The randomized data set (construction described in Materials and Methods) was produced by a randomization of the values for each gene. This produces two lists of numbers, both of which were sorted from least to greatest. The cyclicity values for each rank of gene in order is plotted for the experimental values against the randomized values. The cyclicity in each of the four experiments is therefore compared with the cyclicity in its randomized counterpart. Since the points fall below the diagonal line, this graph shows that there is more cyclicity present in the experimental values than can be explained as arising from chance fluctuations in the measurement process.
Figure 2
Figure 2
Reproducibility of cyclicity between different experiments. For each distinct pair of synchronization methods used to analyze the cell cycle (1), the cyclicity levels for the 1000 genes with the highest standard deviations for one of the experiments are presented as a scatter plot. Thus, for the first line of four boxes, the 1000 genes in the α-factor experiment were identified, and their cyclicities in the α-factor experiment are compared with the cyclicities in the other three experiments. The four diagonal graphs are histograms showing the marginal level of cyclicity in each experiment for all 1000 genes for the selected experiment (listed at the left).
Figure 3
Figure 3
Correlation of peak timing between different experiments. For each set of genes in an experiment the 1000 genes with the highest cyclicities were identified. The phase locations of these genes were then compared in a scatter plot against the phase location in the other three experiments. The phase location was determined for each gene using the fitted Fourier pattern. The graphs on the diagonal are histograms summarizing the frequency of the 1000 genes with the highest cyclicities having peaks of expression at particular times during the cell cycle.
Figure 4
Figure 4
Reproducibility of cyclicity for specific genes for different synchronization experiments. In each panel of four lines are displayed the 100 most cyclic genes from a given synchronization method (1). Each vertical dash indicates the rank cyclicity for a single gene in a single experiment. The first line is the location of the 100 most cyclic genes for the α-factor experiment. Lines 2–4 are the particular genes from line 1 and their relative cyclicity for synchronization by CDC15 arrest, CDC28 arrest and elution. Thus rank cyclicities of genes selected for high cyclicity for one synchronization method are shown for all four synchronization methods. Similarly, the remaining 12 lines are comparative analyses of the data for high cyclicity genes from the CDC15, CDC28 and elution experiments compared with the same genes analyzed by different methods.

References

    1. Spellman P.T., Sherlock,G., Zhang,M.Q., Iyer,V.R., Anders,K., Eisen,M.B., Brown,P.O., Botstein,D. and Futcher,B. (1998) Comprehensive identification of cell cycle-regulated genes of the yeast Saccharomyces cerevisiae by microarray hybridization. Mol. Biol. Cell, 9, 3273–3297. - PMC - PubMed
    1. Cho R.J., Campbell,M.J., Winzeler,E.A., Steinmetz,L., Conway,A., Wodicka,L., Wolfsberg,T.G., Gabrielian,A.E., Landsman,D., Lockhart,D.J. et al. (1998) A genome-wide transcriptional analysis of the mitotic cell cycle. Mol. Cell, 2, 65–73. - PubMed
    1. Aach J., Rindone,W. and Church,G.M. (2000) Systematic management and analysis of yeast gene expression data. Genome Res., 10, 431–445. - PubMed
    1. Aach J. and Church,G.M. (2001) Aligning gene expression time series with time warping algorithms. Bioinformatics, 17, 495–508. - PubMed
    1. Alter O., Brown,P.O. and Botstein,D. (2000) Singular value decomposition for genome-wide expression data processing and modeling. Proc. Natl Acad. Sci. USA, 97, 10101–10106. - PMC - PubMed

Publication types

MeSH terms