. 2002 Jul 1;30(13):2930-9.
doi: 10.1093/nar/gkf401.

On the epigenetic regulation of the human reelin promoter

Affiliations

On the epigenetic regulation of the human reelin promoter

Ying Chen et al. Nucleic Acids Res. .

Abstract

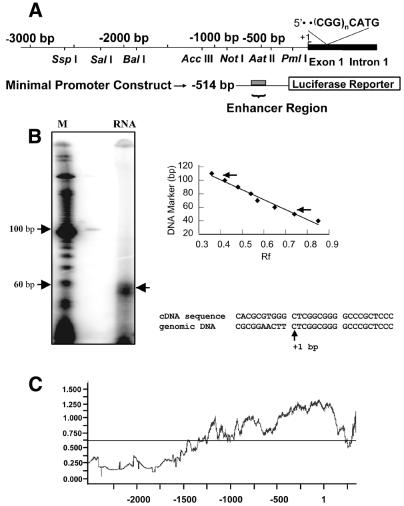
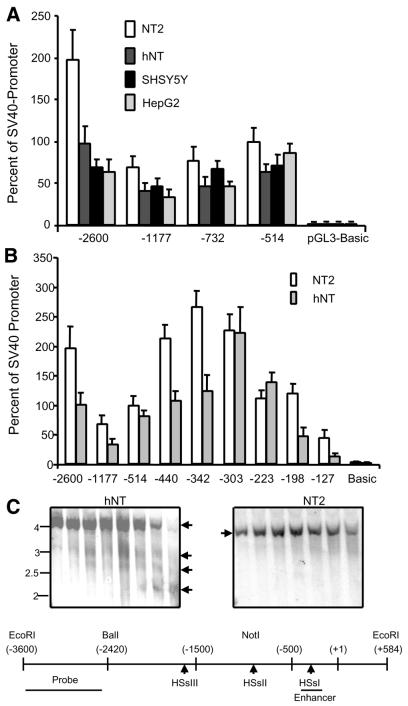
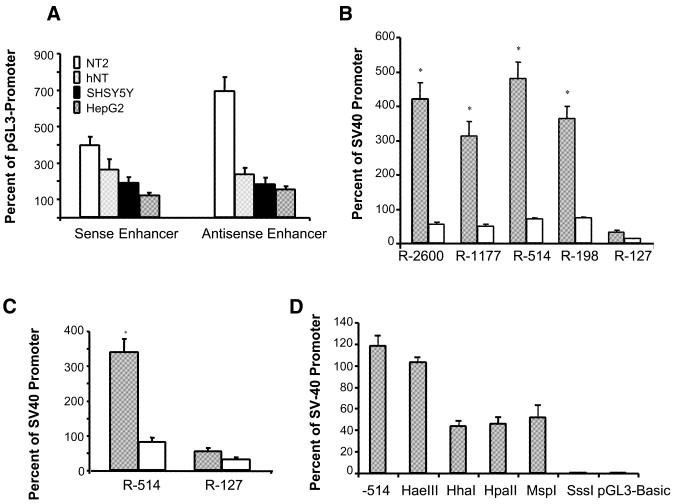
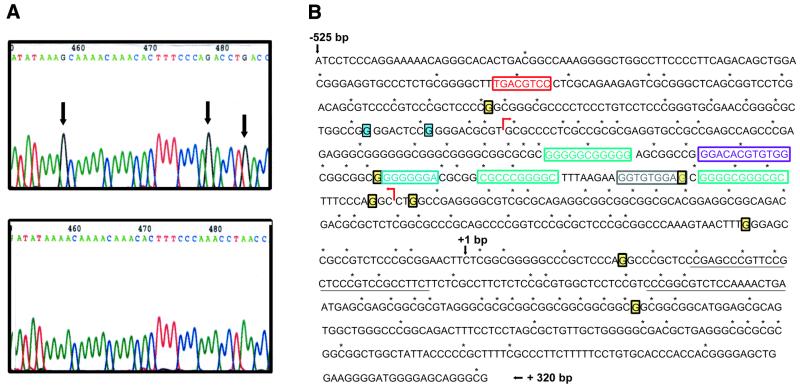
Reln mRNA and protein levels are reduced by approximately 50% in various cortical structures of post-mortem brain from patients diagnosed with schizophrenia or bipolar illness with psychosis. To study mechanisms responsible for this down-regulation, we have analyzed the promoter of the human reelin gene. We show that the reelin promoter directs expression of a reporter construct in multiple human cell types: neuroblastoma cells (SHSY5Y), neuronal precursor cells (NT2), differentiated neurons (hNT) and hepatoma cells (HepG2). Deletion constructs confirmed the presence of multiple elements regulating Reln expression, although the promoter activity is promiscuous, i.e. activity did not correlate with expression of the endogenous gene as reflected in terms of reelin mRNA levels. Co-transfection of the -514 bp human reelin promoter with either Sp1 or Tbr1 demonstrated that these transcription factors activate reporter expression by 6- and 8.5-fold, respectively. Within 400 bp of the RNA start site there are 100 potential CpG targets for DNA methylation. Retinoic acid (RA)-induced differentiation of NT2 cells to hNT neurons was accompanied by increased reelin expression and by the appearance of three DNase I hypersensitive sites 5' to the RNA start site. RA-induced differentiation was also associated with demethylation of the reelin promoter. To test if methylation silenced reelin expression, we methylated the promoter in vitro prior to transfection. In addition, we treated NT2 cells with the methylation inhibitor aza-2'-deoxycytidine and observed a 60-fold increase in reelin mRNA levels. The histone deacetylase inhibitors trichostatin A (TSA) and valproic acid also induced expression of the endogenous reelin promoter, although TSA was considerably more potent. These findings indicate that one determinant responsible for regulating reelin expression is the methylation status of the promoter. Our data also raise the interesting possibility that the down-regulation of reelin expression documented in psychiatric patients might be the consequence of inappropriate promoter hypermethylation.


Figures

Figure 1
Figure 1
Reelin promoter structure and transient transfections. (A) Schematic representation of the cloned human reelin promoter. The top line shows a linear representation of sequences along the BAC DNA and associated restriction enzyme cleavage sites. The transcriptional start site is indicated (+1). The position of the CGG repeat present in the 5′ UTR of the first exon is shown where n varies from 4 to 24 repeats. The subcloned minimal promoter/luciferase reporter vector contains a region (reelin enhancer) that acts to enhance expression of the SV40 promoter. (B) Primer extension analysis. The products of reverse transcription of SHSY5Y RNA using the +60 bp primer is shown. To the right of the gel is the standard curve that was generated and the position of migration of this product and that corresponding to the +110 bp primer. The sequence alignment shows a comparison of the human reelin cDNA (GenBank accession no. NM_005045) and the genomic sequence (as shown in Fig. 4B). Similar results were obtained using RNA from HepG2 cells (data not shown). (C) CpG islands plot of the human reelin promoter and first exon. The CpG islands plot was generated using GeneTool software (BioTools) that is based on an algorithm that plots the observed number of CpG sites divided by the expected number of CpG sites along the length of the DNA fragment. The numbering is based on the RNA start site being equal to +1. y-axis values above the horizontal line indicate regions likely to be CpG islands (28).
Figure 2
Figure 2
Transfection analysis of the reelin promoter. (A) Transfection of the reelin promoter/luciferase reporter constructs into various cell lines. The restriction sites indicated in Figure 1A were used to generate the promoter fragments (–2600 contains 2.6 kb of 5′ flanking sequence; –1177, 1177 bp of 5′ flanking sequence; R-732, 732 bp of 5′ flanking sequence; R-514, 514 bp of 5′ flanking sequence). (B) Results obtained by transfection of various reelin promoter constructs and deletions into either NT2 neuroprogenitor cells or hNT neurons. The number below each pair of bars indicates the amount of 5′ flanking sequence present in the construct (relative to the RNA start site). Data represent the mean obtained from three measurements made from a minimum of three separate experiments after correcting for transfection efficiency. (C) DNase I hypersensitive sites are present in hNT neurons and not NT2 neuroprogenitor cells. NT2 cells were incubated with RA to induce differentiation as indicated in Materials and Methods. Nuclei were isolated from both cell types and incubated with DNase I. The genomic DNA was resolved by agarose gel electrophoresis and Southern blotted onto nitrocellulose membranes. The indicated probe was used to visualize the relevant bands. Arrows indicate sites that are hypersensitive. The genomic sequence is represented in the bottom portion of the panel with the approximate positions of the hypersensitive sites relative to the start site. The DNA probe used is indicated at the 5′-most portion of the promoter.
Figure 3
Figure 3
Analysis of the reelin promoter proximal sequences. (A) Sequences between –303 and –137 activate expression of the SV40 promoter. This region of the reelin promoter was subcloned 5′ to the SV40 promoter in both sense and antisense oritentations to test for enhancer-like activity. These data are expressed relative to that obtained with the SV40 promoter containing vector alone (pGL3-Promoter). (B) The mouse Tbr1 cDNA was co-transfected with several reelin promoter/reporter constructs. The shaded bar indicates Tbr1 co-transfection while the unshaded bar indicates the same plasmid but without co-transfection of the Tbr1 sequence. The data are expressed relative to the SV40 promoter construct (pGL3-Promoter) transfected in parallel. (C) An Sp1 expression vector was co-transfected with either the –514 bp promoter or the –127 promoter/reporter. The shaded bar shows the Sp1 co-transfection while the unshaded bar shows results from the parent (no Sp1) plasmid co-transfection. (D) Bacterial methylases were used to methylate the reelin –514 bp promoter/reporter construct in vitro prior to transfection. The first bar (–514) represents the data obtained from transfecting the unmethylated –514 reelin promoter/reporter construct. The specificity of each indicated methylase is indicated in the text. The constructs were introduced into NT2 cells and reporter activity was measured. Except for the HaeIII methylase, results obtained for the modified constructs were different from the unmodified –514 bp promoter. All data are expressed relative to the mean signal obtained using the SV40 promoter/luciferase reporter transfections that were performed in parallel. *,P < 0.001.
Figure 4
Figure 4
Methylation status of the reelin promoter. (A) Genomic DNA was isolated from NT2 cells (top) or RA-differentiated hNT neurons (bottom) and modified using the bisulfite reaction. The DNA was amplified and subcloned. Subsequent sequencing showed differences indicated by the arrows in which the presence of a G residue indicates a methylated cytosine on the opposite strand. The numbering refers to the position in the sequencing chromatogram. A total of eight residues were modified in NT2 cells while two different G residues were methylated in the hNT neurons. (B) Data obtained from the methylation studies are summarized. Individual G residues shaded yellow were methylated in NT2 cells, while those that are boxed and shaded blue were methylated in hNT neurons. The red arrows show the boundaries of the enhancer region. The boxed base pairs indicate putative binding sites for a variety of transcription factors, including Sp1 (aqua), CREB (red), N-myc (purple), Mzf1 (light blue) and Tbr1 (gray). The middle Sp1 site is also a putative AP-2 element. Sequences underlined downstream of +1 indicate the position of the primer used in the primer extension analysis (Fig. 1B).

References

    1. Impagnatiello F., Guidotti,A.R., Pesold,C., Dwivedi,Y., Caruncho,H., Pisu,M.G., Uzunov,D.P., Smalheiser,N.R., Davis,J.M., Pandey,G.N., Pappas,G.D., Tueting,P., Sharma,R.P. and Costa,E. (1998) A decrease of reelin expression as a putative vulnerability factor in schizophrenia. Proc. Natl Acad. Sci. USA, 95, 15718–15723. - PMC - PubMed
    1. Costa E., Davis,J., Grayson,D.R., Guidotti,A., Pappas,G.D. and Pesold,C. (2001) Dendritic spine hypoplasia and downregulation of reelin and GABAergic tone in schizophrenia vulnerability. Neurobiol. Dis., 8, 723–742. - PubMed
    1. Guidotti A., Auta,J., Davis,J., Dwivedi,Y., Grayson,D.R., Impagnatiello,F., Pandey,G., Pesold,C., Sharma,R., Uzunov,D. and Costa,E. (2000) Reelin and GAD67 expression is decreased in postmortem brain of schizophrenia and bipolar disorder patients. Arch. Gen. Psychiatr., 57, 1061–1069. - PubMed
    1. Selemon L.D. and Goldman-Rakic,P.S. (1999) The reduced neuropil hypothesis: a circuit based model of schizophrenia. Biol. Psychiatr., 45, 17–25. - PubMed
    1. Fatemi S.H., Earle,J.A. and McMenomy,T. (2000) Reduction in reelin immunoreactivity in hippocampus of subjects with schizophrenia, bipolar disorder and major depression. Mol. Psychiatr., 5, 654–663. - PubMed

Publication types

MeSH terms