

doi: 10.1073/pnas.142033699.
Epub 2002 Jun 27.
Tracking the ecological overshoot of the human economy
Affiliations
- PMID: 12089326
- PMCID: PMC123129
- DOI: 10.1073/pnas.142033699
Item in Clipboard
Tracking the ecological overshoot of the human economy
Proc Natl Acad Sci U S A.
.
Abstract
Sustainability requires living within the regenerative capacity of the biosphere. In an attempt to measure the extent to which humanity satisfies this requirement, we use existing data to translate human demand on the environment into the area required for the production of food and other goods, together with the absorption of wastes. Our accounts indicate that human demand may well have exceeded the biosphere's regenerative capacity since the 1980s. According to this preliminary and exploratory assessment, humanity's load corresponded to 70% of the capacity of the global biosphere in 1961, and grew to 120% in 1999.
Figures
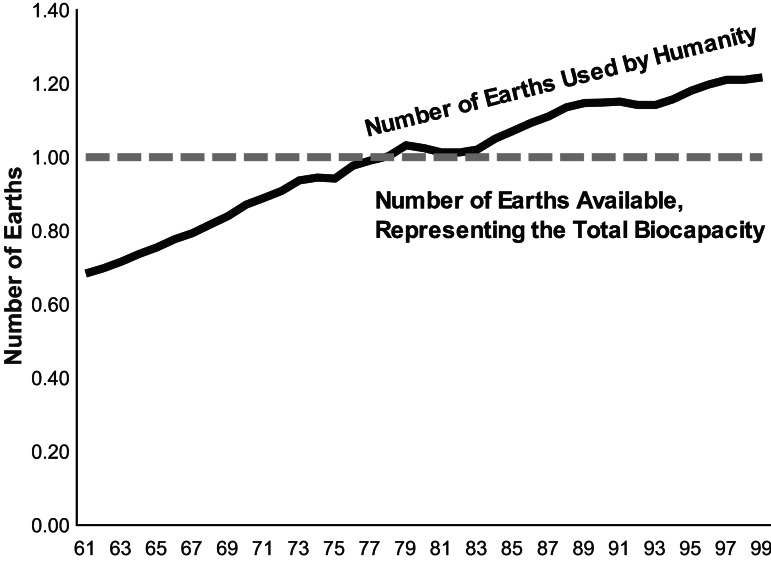
Time trend of humanity's ecological demand. This graph shows human
demand over the last 40 years as compared with the earth's ecological
capacity for each year. One vertical unit in the graph corresponds to
the entire regenerative capacity of the earth in a given year. Human
demand exceeds nature's total supply from the 1980s onwards,
overshooting it by 20% in 1999. If 12% of the bioproductive area were
set aside to protect other species, the demand line crosses the supply
line in the early 1970s rather than the 1980s.
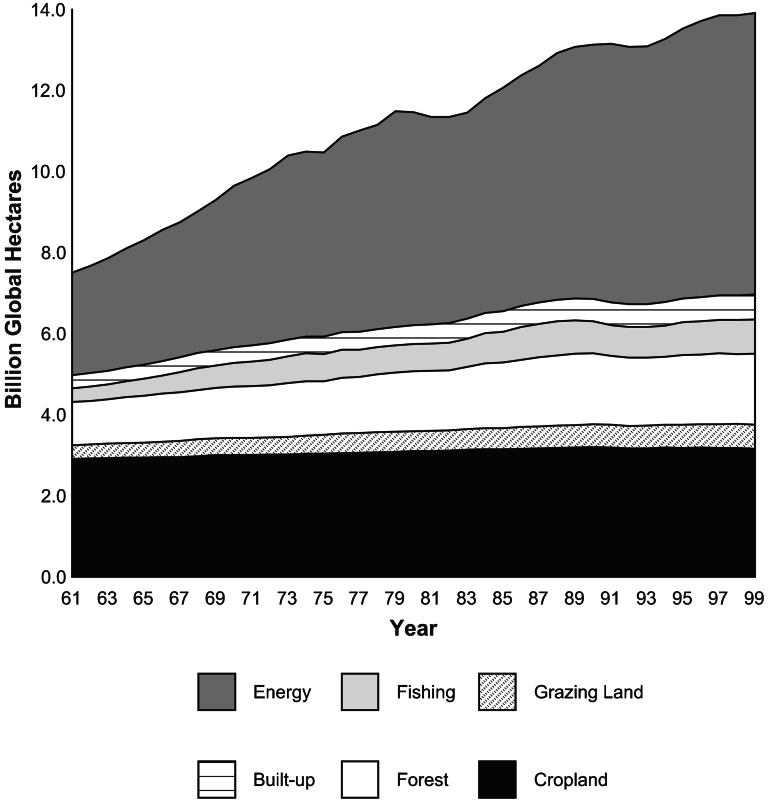
Global ecological demand over time, in global hectares. This graph
documents humanity's area demand in six different categories. The six
categories are shown on top of each other, demonstrating a total area
demand of over 13 billion global hectares in 1999. Global hectares
represent biologically productive hectares with global average
bioproductivity in that year.
References
-
- Vitousek P M, Ehrlich P R, Ehrlich A H, Matson P A. BioScience. 1986;34:368–373.
-
- Odum H T. Environmental Accounting: EMERGY and Environmental Decisionmaking. New York: Wiley; 1996.
-
- Fischer-Kowalski M, Hüttler W. J Ind Ecol. 1998;2:107–137.
-
- United Nations Environment Programme & Stockholm Environment Institute. Global Environment Outlook 2000. New York: Oxford Univ. Press; 1999.
-
- World Resources Institute, United Nations Development Programme, United Nations Environment Programme; World Bank. World Resources 2000–2001, People and Ecosystems: The Fraying Web of Life. New York: Oxford Univ. Press; 2000.
MeSH terms
Substances
LinkOut - more resources
Full Text Sources
