. 2002 Jul 9;99(14):9527-32.
doi: 10.1073/pnas.142305699. Epub 2002 Jun 27.

The relationship between cortical activation and perception investigated with invisible stimuli

Affiliations

The relationship between cortical activation and perception investigated with invisible stimuli

K Moutoussis et al. Proc Natl Acad Sci U S A. .

Abstract

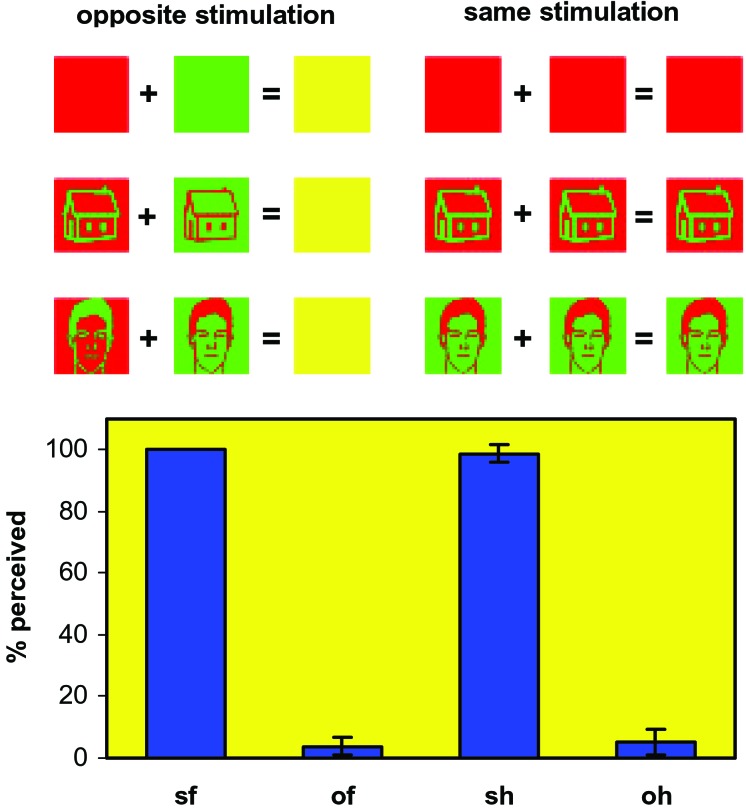
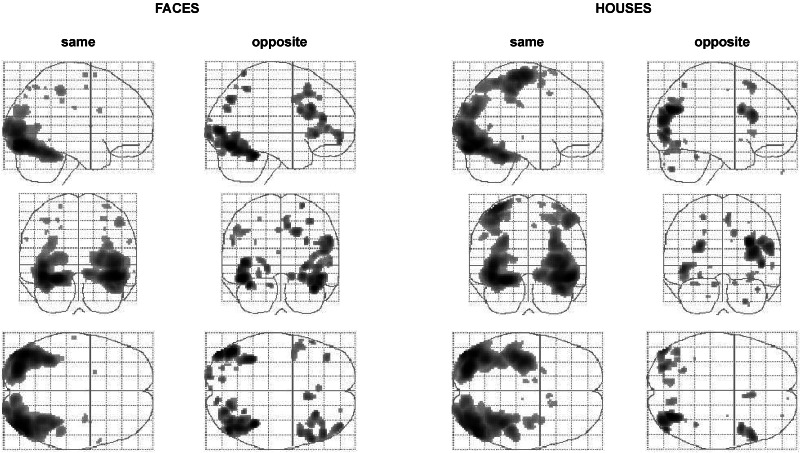
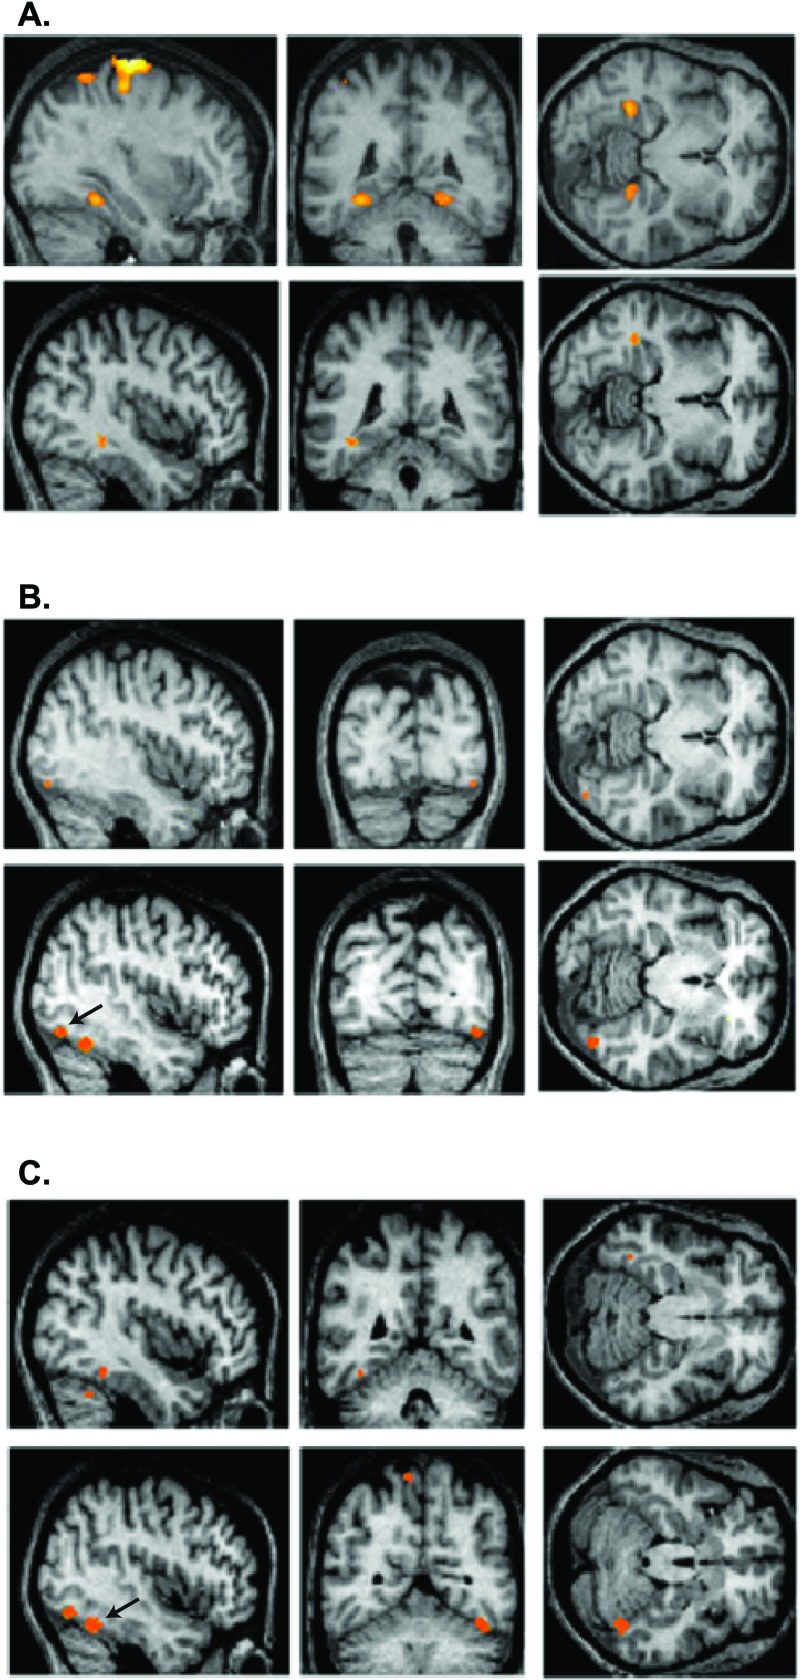
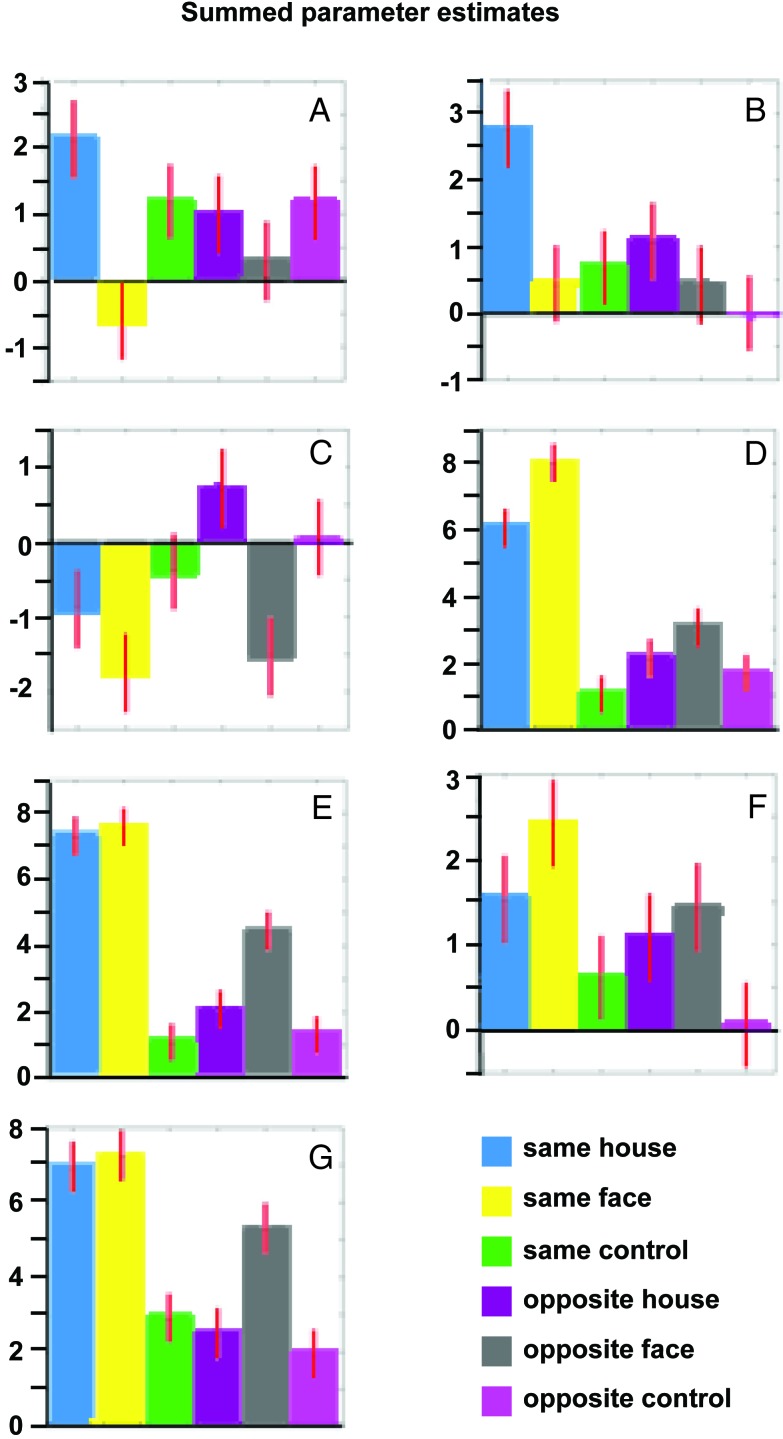
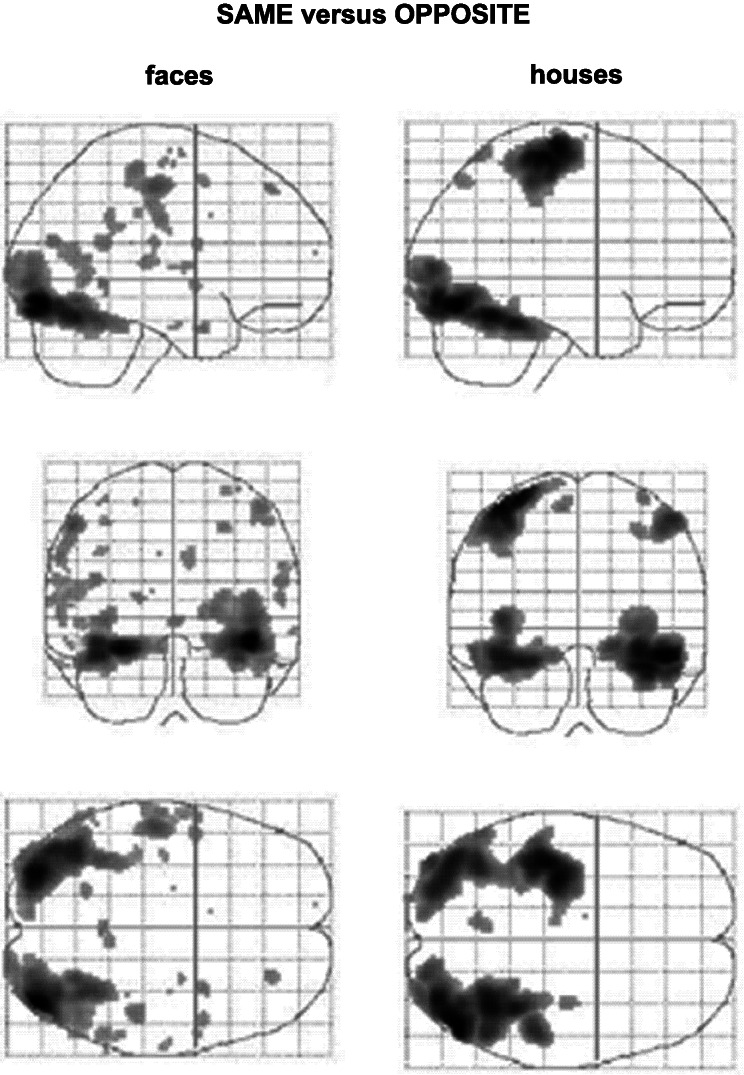
The aim of this work was to study the relationship between cortical activity and visual perception. To do so, we developed a psychophysical technique that is able to dissociate the visual percept from the visual stimulus and thus distinguish brain activity reflecting the perceptual state from that reflecting other stages of stimulus processing. We used dichoptic color fusion to make identical monocular stimuli of opposite color contrast "disappear" at the binocular level and thus become "invisible" as far as conscious visual perception is concerned. By imaging brain activity in subjects during a discrimination task between face and house stimuli presented in this way, we found that house-specific and face-specific brain areas are always activated in a stimulus-specific way regardless of whether the stimuli are perceived. Absolute levels of cortical activation, however, were lower with invisible stimulation compared with visible stimulation. We conclude that there is no terminal "perceptual" area in the visual brain, but that the brain regions involved in processing a visual stimulus are also involved in its perception, the difference between the two being dictated by a higher level of activity in the specific brain region when the stimulus is perceived.


Figures

Figure 1
Figure 1
A schematic presentation of the stimulation method used in this study and the averaged performance of the seven subjects in the face/house/nothing discrimination task. Dichoptic stimuli of opposite color contrast between the two eyes were invisible (opposite stimulation), whereas identical stimuli of the same color contrast were perceived the vast majority of the times (same stimulation). Pictures of houses, faces, and uniformly colored controls were used. The input to the two eyes and the expected perceptual output (Upper) and subjects' true psychophysical performance of the subjects (Lower) are shown. Continuous fusion of the stimuli was achieved by using repetitive brief presentations (see Methods). sf, same faces; of, opposite faces; sh, same houses; oh, opposite houses. The averaged percentage of the number of stimuli perceived is shown (of a total of 448 per subject per stimulus category) together with the standard error between the subjects. Control stimuli were never perceived either as a face or a house. The few trials in which subjects had perceived an opposite stimulus were modeled separately in the design matrix (see Methods) and thus did not influence the pattern of brain activation.
Figure 2
Figure 2
Glass-brain presentations of group results of the activation produced by the opposite and same dichoptic stimulation with pictures of faces and houses (compared with that produced by their corresponding control). Large regions of binocularly driven prestriate visual areas are activated even when the two monocular stimuli cancel each other out at the binocular level, resulting in an identical and null percept in the two opposite stimulations (opposite face/house-opposite control) that is the same as that of the control. The brain regions activated by the opposite stimulation also are much the same as those activated by the same stimulation but are less extensive. With the same houses, there is also activity in the motor cortex, which might be caused by the fact that the button-press of the subjects (to report house) was made by the third finger and thus was more difficult than the other two.
Figure 3
Figure 3
Group results of brain regions showing stimulus-specific activation under conditions of same and opposite stimulation, revealing that such activation correlates with perceived and not-perceived conditions. (A Upper) The contrast same houses-same faces shows bilateral stimulus-specific activation in the parahippocampal gyrus (Talairach coordinates, −30, −44, −12 and 26, −44, −10). (Lower) The contrast opposite houses-opposite faces shows unilateral stimulus-specific activation in the same region (−38, −42, −10). (B Upper) The contrast same faces-same houses reveals stimulus-specific activation in a region of the fusiform gyrus (42, −82, −12). (Lower) The contrast opposite faces-opposite houses reveals stimulus-specific activation in the same brain region (44, −74, −14), shown here by the arrow. (C Upper) the contrast same faces-same control when exclusively masked by the contrast same houses-same control revealed another region in the fusiform gyrus (−38, −48, −18) showing face-specific activation. (Lower) The same brain region in the opposite hemisphere (44, −56, −22) also shows much more significant face-specific activation under the contrast opposite faces-opposite houses; this area is shown by the arrow to distinguish it from the second area revealed by the same contrast.
Figure 4
Figure 4
Group results of summed parameter estimates for the six different stimulation conditions in the seven different brain regions shown in Fig. 3 (mean parameter estimates can be calculated by dividing the y axes values by 28). Talairach coordinates: A, −30, −44, −12; B, 26, −44, −10; C, −38, −42, −10; D, 42, −82, −12; E, 44, −74, −14; F, −38, −48, −18; G, 44, −56, −22. In each region the preference for face or house is identical in the same and opposite conditions; however, in some voxels this preference is statistically significant for the former and in some for the latter (with the exception of F). Also, the parameter estimates for the same condition are usually higher than those for the opposite condition, i.e., although the same brain regions are involved and show stimulus-specific activation in both conditions, the level of this activation is higher where there is a perceptual outcome.
Figure 5
Figure 5
Glass-brain presentations of group results of the activation produced by the comparisons same face-opposite face (Left) and same house-opposite house (Right). This contrast reveals differential activation under conditions in which the same stimulus results in a different percept. Comparison of these results with those in Fig. 2 shows that all the areas involved in the processing of faces and houses are more active when stimulus processing results in a visual percept than when it does not.

References

    1. Frith C, Perry R, Lumer E. Trends Cogn Sci. 1999;3:105–114. - PubMed
    1. Logothetis N K, Schall J D. Science. 1989;245:761–763. - PubMed
    1. Leopold D A, Logothetis N K. Nature (London) 1996;379:549–553. - PubMed
    1. Sheinberg D L, Logothetis N K. Proc Natl Acad Sci USA. 1997;94:3408–3413. - PMC - PubMed
    1. Tong F, Nakayama K, Vaughan J T, Kanwisher N. Neuron. 1998;21:753–759. - PubMed

Publication types

LinkOut - more resources