Comparative Study
. 2002;3(6):RESEARCH0026.
doi: 10.1186/gb-2002-3-6-research0026. Epub 2002 May 14.

Physical mapping of genes in somatic cell radiation hybrids by comparative genomic hybridization to cDNA microarrays

Affiliations
Comparative Study

Physical mapping of genes in somatic cell radiation hybrids by comparative genomic hybridization to cDNA microarrays

Johann Y Lin et al. Genome Biol. 2002.

Abstract

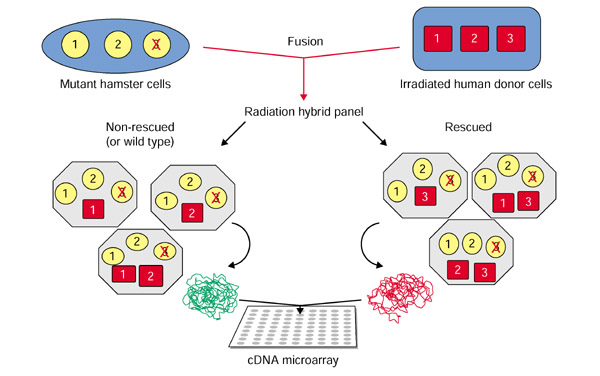
Background: Somatic cell mutants can be informative in the analysis of a wide variety of cellular processes. The use of map-based positional cloning strategies in somatic cell hybrids to analyze genes responsible for recessive mutant phenotypes is often tedious, however, and remains a major obstacle in somatic cell genetics. To fulfill the need for more efficient gene mapping in somatic cell mutants, we have developed a new DNA microarray comparative genomic hybridization (array-CGH) method that can rapidly and efficiently map the physical location of genes complementing somatic cell mutants to a small candidate genomic region. Here we report experiments that establish the validity and efficacy of the methodology.

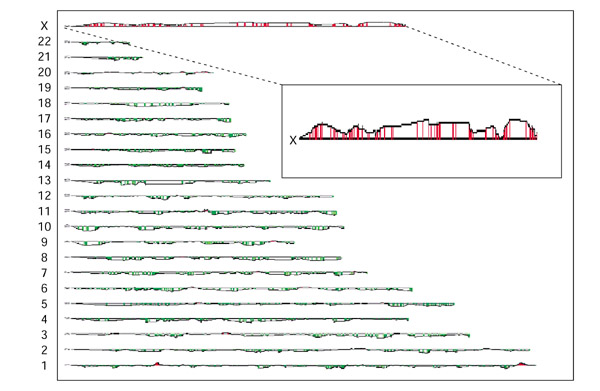
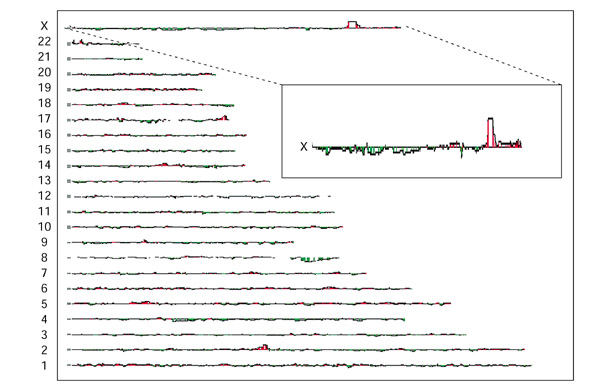
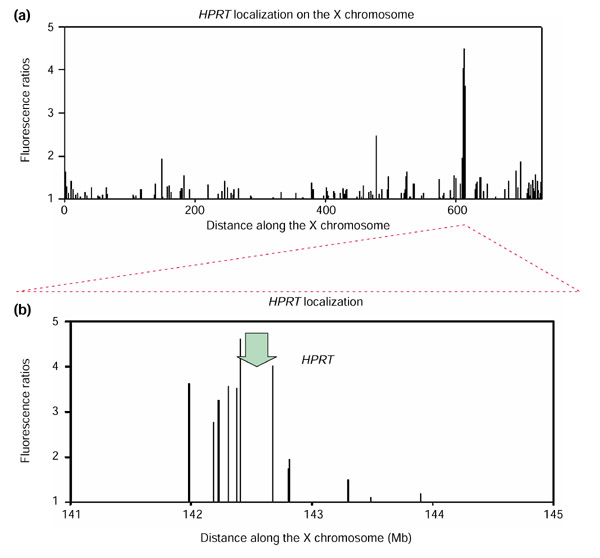
Results: CHO cells deficient for hypoxanthine:guanine phosphoribosyl transferase (HPRT) were fused with irradiated normal human fibroblasts and subjected to HAT selection. Cy5-labeled genomic DNA from the surviving hybrids containing the HPRT gene was mixed with Cy3-labeled genomic DNA from normal CHO cells and hybridized to a microarray containing 40,185 cDNAs, representing 29,399 genes (UniGene clusters). The DNA spots with the highest Cy5:Cy3 fluorescence ratios corresponded to a group of genes mapping within a 1 Mb interval centered near position 142.7 Mb on the X chromosome, the genomic location of HPRT.

Conclusion: The results indicate that our physical mapping method based on radiation hybrids and array-CGH should significantly enhance the speed and efficiency of positional cloning in somatic cell genetics.


Figures

Figure 1
Figure 1
Schematic diagram of the radiation hybrid array-CGH methodology. Mutant rodent cells that have a recessive phenotype due to a mutation in a gene (gene 3, depicted as a red cross), are complemented by cell fusion with irradiated human donor cell lines. The resulting cells in the radiation-hybrid panel contain a full complement of the hamster genome as well as fragments of the human genome. Hybrids are complemented when they have retained the functional human chromosome fragment bearing the rescuing gene (in this case gene 3), resulting in restoration of the wild-type phenotype. Hybrids that were not complemented retain only random fragments of the donor genome (for example genes 1 and 2). The complemented and the non-complemented populations are separated by selection, resulting in enrichment of gene 3 in the complemented cells, which are used as the source of the test DNA probes (versus wild-type CHO DNA) on the array.
Figure 2
Figure 2
Mapping of retained human genomic sequences in a rodent cell. As a proof of principle, test genomic DNA from a monochromosomal CHO-human hybrid cell line containing the human X chromosome was co-hybridized with reference genomic CHO cell DNA on the microarray. Regions of increased fluorescence ratios in the test DNA, relative to reference DNA, are indicated in red. The magnitude of the increase in fluorescence ratios between the test and reference samples is indicated by the height of the line (log10 scale) compared with the baseline, which represents equal DNA copy numbers and has a fluorescence ratio of 1. Fluorescence ratios are drawn as a moving average of five adjacent genes/ESTs along the chromosome. Note the marked increased fluorescence ratios along the X chromosome (inset, with an expanded vertical scale).
Figure 3
Figure 3
Specificity of the array-CGH mapping method for mapping a complementing gene. Total genomic DNA of the complemented HPRT-deficient CHO-human radiation hybrid cells was co-hybridized with total genomic DNA from wild-type CHO cells on the microarray. The complemented hybrid cells contain the complete CHO genome and human chromosomal fragments. The human sequences are enriched in fragments bearing the complementing human HPRT gene. The magnitude of the increase in fluorescence ratio between the test and reference samples is indicated by the height of the red line (log10 scale) compared with the baseline, which has a fluorescence ratio of 1. Fluorescence ratios are drawn as a moving average of five adjacent genes/ESTs along the chromosome. Note that the region around the HPRT locus at Xq26 (inset) corresponds to a sharp maximum in the fluorescence ratio increase, indicating a corresponding gain in DNA copy number for genomic elements in that region. No such consistent copy-number gains were observed in other parts of the genome.
Figure 4
Figure 4
Resolution of the array-CGH mapping method. (a) For the microarray comparison between the complemented HPRT-deficient CHO-human radiation hybrid cell DNA versus wild-type CHO DNA, fluorescence ratios are depicted for chromosomal region Xq24-Xqter. In this depiction, non-averaged fluorescence ratios are plotted; therefore, amplitudes reflect actual measured fluorescence ratios for each gene/EST (log10 scale). A sharp maximum of fluorescence ratios is observed in the region surrounding the HPRT locus on the human X chromosome, indicating the retention, and therefore the gain, of DNA copy number for genes in this region. The units for the distance along the X chromosome are units for radiation hybrid distances (cR3000) as defined in [5]. (b) Close-up depiction of the fluorescence ratio peak observed around the HPRT locus on the human X chromosome. The peak region covers approximately 900,000 base pairs. Gene/EST array elements around the HPRT locus (indicated by the green arrow) are located according to their genomic positions, and fluorescence ratios are depicted on a log10 scale.

Similar articles

Cited by

References

    1. Stark GR, Gudkov AV. Forward genetics in mammalian cells: functional approaches to gene discovery. Hum Mol Genet. 1999;8:1925–1938. - PubMed
    1. List of genes cloned by positional cloning http://genome.nhgri.nih.gov/clone
    1. Lin JY, Bedford JS. Regional gene mapping using mixed radiation hybrids and reverse chromosome painting. Radiat Res. 1997;148:405–412. - PubMed
    1. Pinkel D, Segraves R, Sudar D, Clark S, Poole I, Kowbel D, Collins C, Kuo WL, Chen C, Zhai Y, et al. High resolution analysis of DNA copy number variation using comparative genomic hybridization to microarrays. Nat Genet. 1998;20:207–211. - PubMed
    1. Pollack JR, Perou CM, Alizadeh AA, Eisen MB, Pergamenschikov A, Williams CF, Jeffrey SS, Botstein D, Brown PO. Genome-wide analysis of DNA copy-number changes using cDNA microarrays. Nat Genet. 1999;23:41–46. - PubMed

Publication types

MeSH terms

Substances